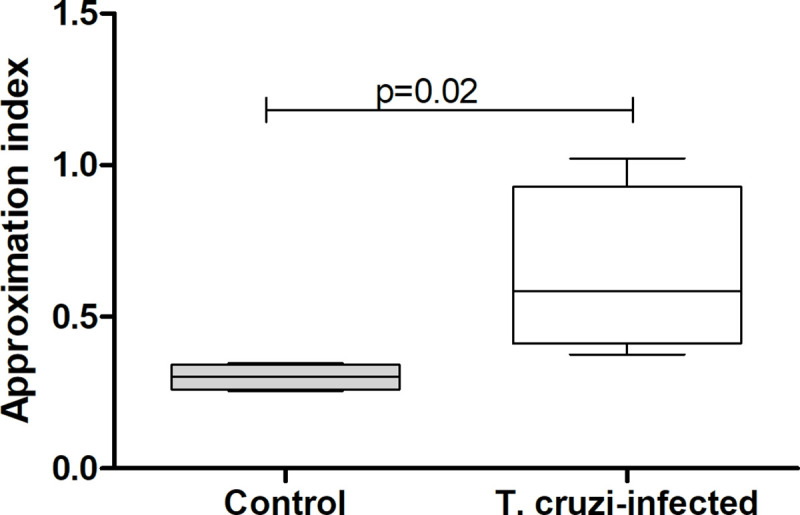
Fig 3. Nymph approximation index comparing the spatial relation between Rhodnius prolixus nymphs and hosts, as a function of infection status.

Data depicted represent the median (horizontal line) of the cumulative number of nymphs found closer than 1.5 cm from the host in the last five minutes of each recorded hour normalized by the total number of nymphs present in each of four independent assays (25% - 75%, Max—Min).
