
Fig 1. Absolute tidal volume and corrected tidal volume (by predicted body weight or absolute body weight) over years and according to tertiles of year.
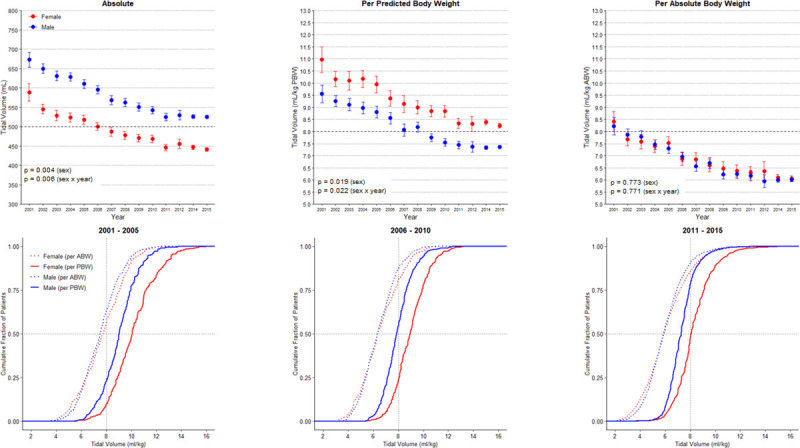
PBW: predicted body weight; ABW: actual body weight. p values for the sex reflect the overall test for difference between sex over the years while p values for the sex x year interaction evaluate if change over time differed by sex. There is no interaction between dataset and sex (p = 0.311, p = 0.100, p = 0.483 for absolute, corrected by PBW or ABW, respectively), or dataset and sex x year interaction (p = 0.310, p = 0.100, p = 0.482 for absolute, corrected by PBW or ABW, respectively).