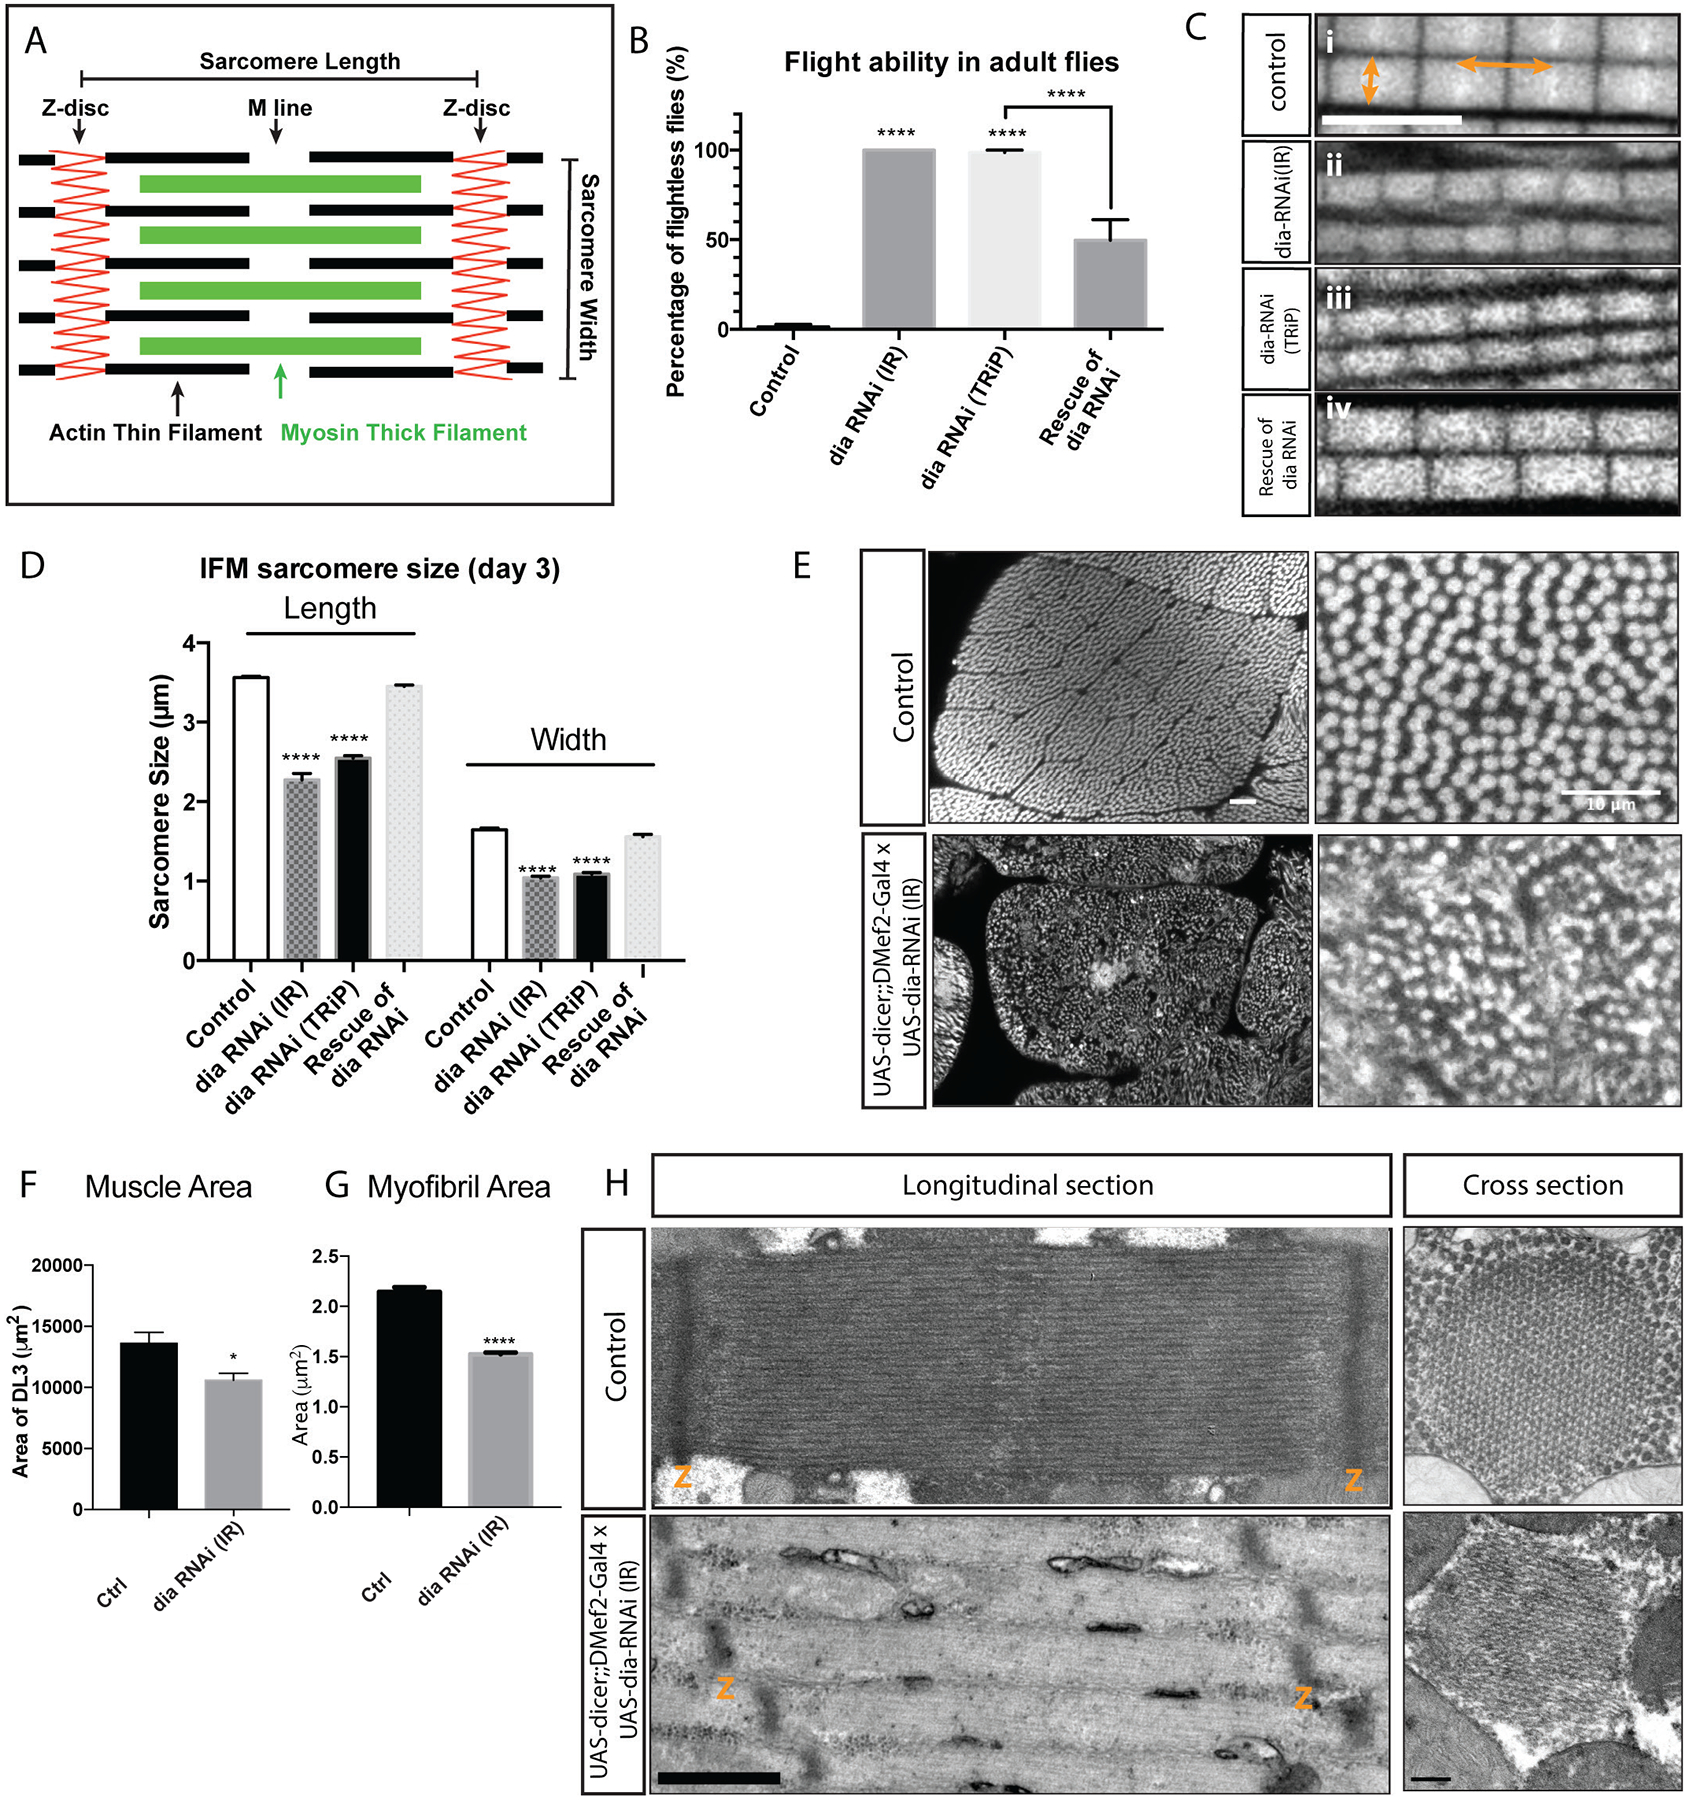
Figure 1: Knockdown of Diaphanous impairs flight ability and sarcomere size in IFMs.

A. Schematic diagram of the structure of the sarcomere, noting Z disc, M line, thin and thick filaments. Length and width of the sarcomere are indicated. B. Flight assay: 25 flies per replicate, 3 replicates per genotype, n= 75 flies. The flight ability of individual flies was tested 3 days after eclosion. dia RNAi constructs were expressed in muscles with UAS-dicer2;;DMef2-Gal4. Reduced Dia activity resulted in impaired flight ability (p<0.0001). Rescue experiments were performed by expressing Dia::GFP in muscles along with dia RNAi (TRiP). The ability to fly was partially rescued by expressing Dia::GFP (p<0.0001). C. Myofibril and Sarcomere organization in flight muscle. Sarcomere length is indicated by the horizontal arrows, and sarcomere width is marked by the vertical arrows. Scale bar: 5μm; D. Quantification of sarcomere length and width: 5 flies per genotype, n = 5 average sarcomere length or width measurements per fly. In muscles with reduced Dia activity, both sarcomere length and width are significantly reduced (p<0.0001). Expressing Dia::GFP in the muscles restores flight capability, sarcomere length and width. E. Muscle cross sections indicating muscle size and myofibril organization. Scale bar: 10μm. F. Quantification of DLM3 cross-sectional areas: DLM3 from 5 flies per genotype, control n = 6 and dia-RNAi = 7 DLM3 muscles). In muscles with reduced Dia activity, muscle area is smaller than that of the controls, *p<0.05). G. Quantification of flight muscle myofibril area: 5 flies per genotype, 5 average myofibril area measurements per fly, n = 25 average myofibril area measurements per genotype. In muscles with reduced Dia activity, myofibril area is significantly smaller than that of the controls (****p<0.0001). H. Sarcomere morphology of newly eclosed adults using Transmission Electron Microscopy (TEM). Dia knockdown results in shorter and thinner sarcomeres. The numbers of thin and thick filaments are reduced. Scale bar: longitudinal sections: 600nm, cross sections: 200nm.
