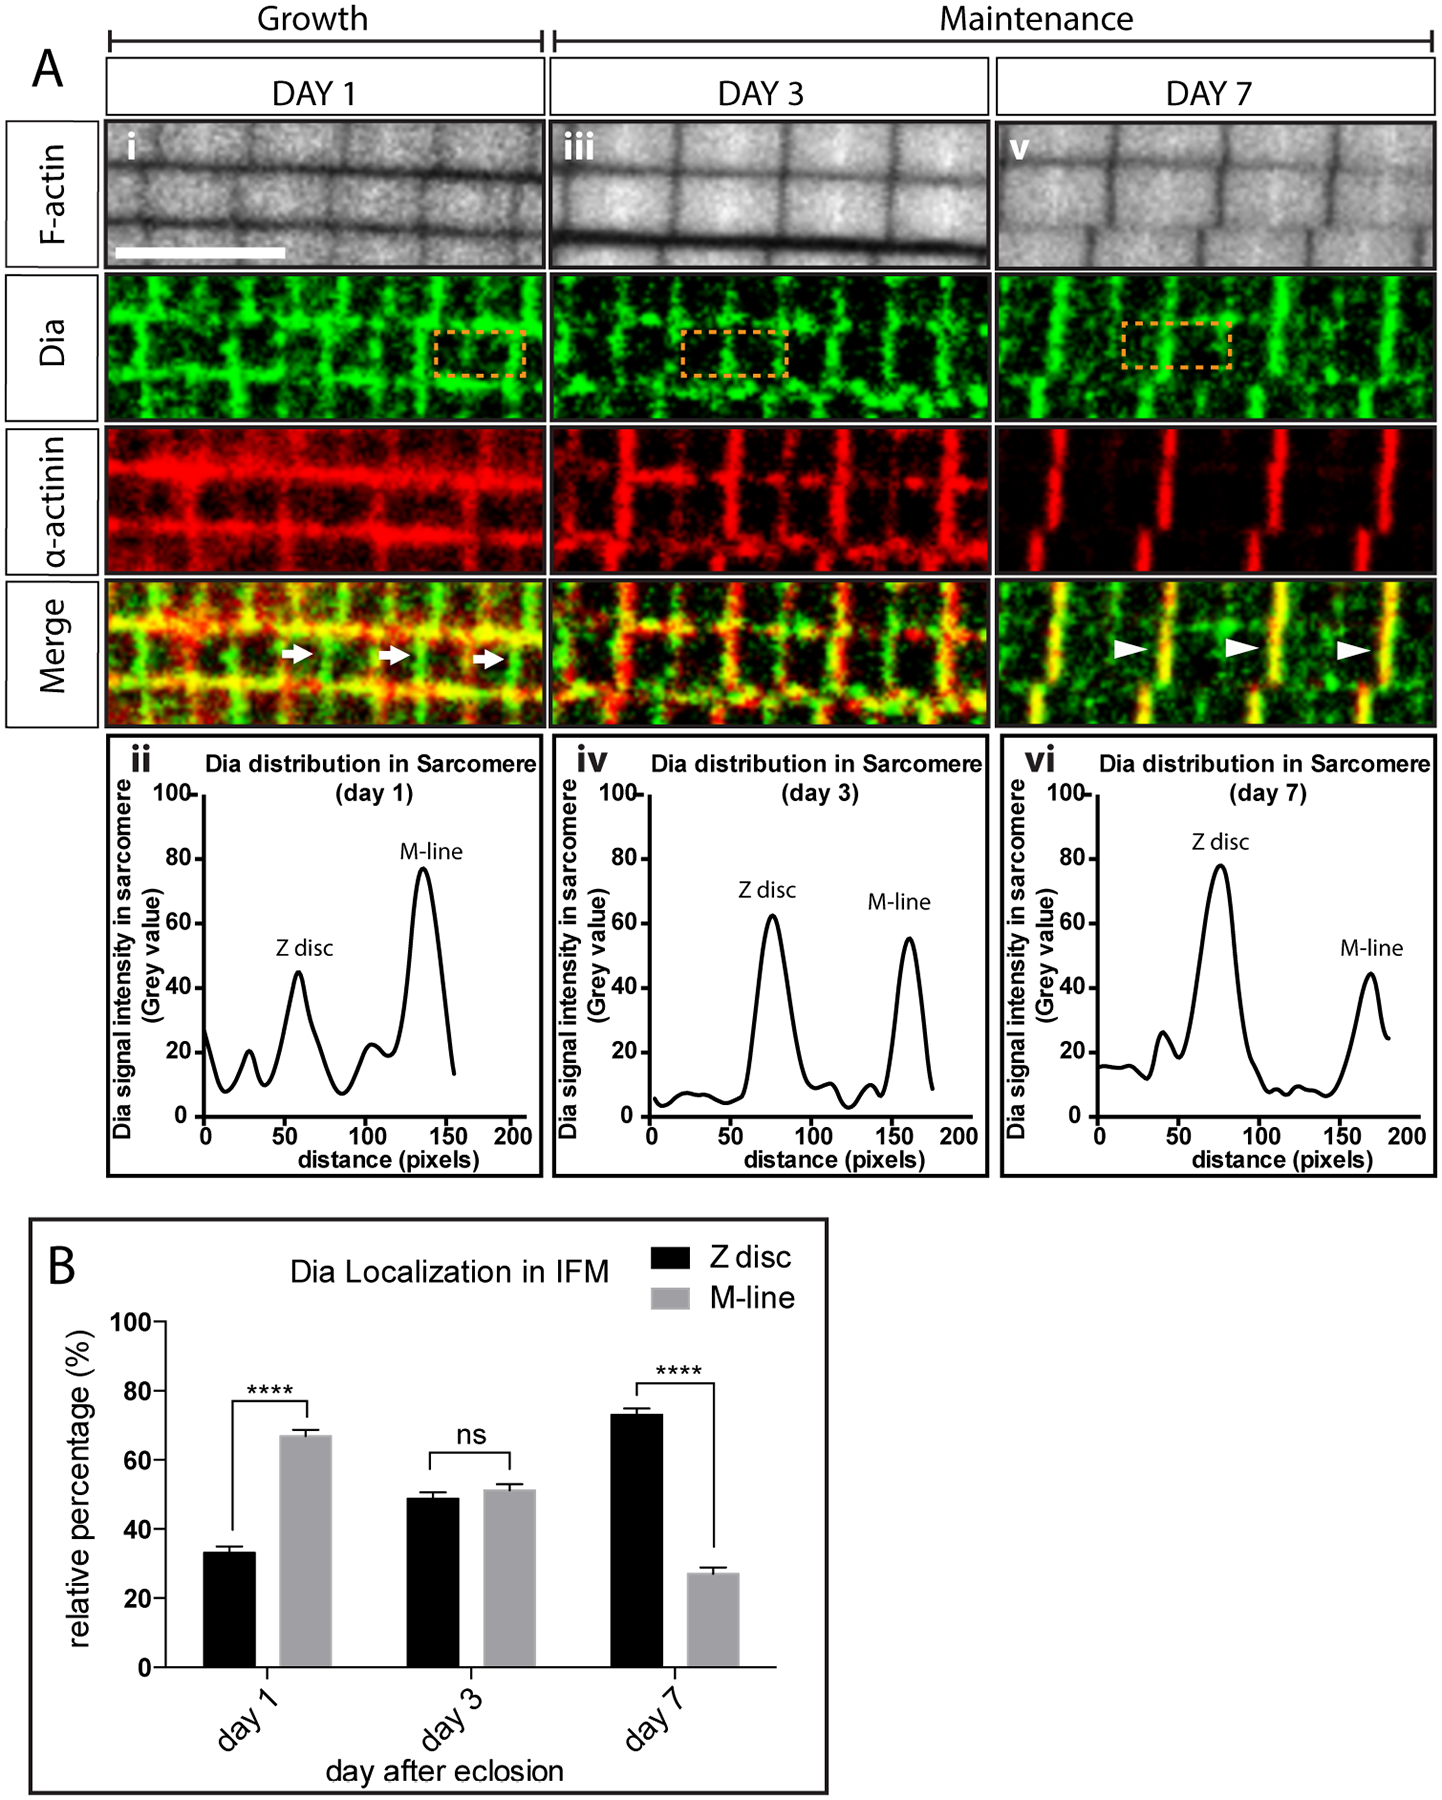
Figure 4: Diaphanous localization in IFM sarcomeres.

A. Dia localization in flies from day 1 (i), 3 (iii) and 7(v) after eclosion. Sarcomere thin filaments are labeled with Phalloidin (white). Z-discs are labeled with an antibody against α-actinin (red). Dia localization is visualized by staining with an antibody against Dia (green). Dia localizes mainly to the M-lines (arrow) 1 day after eclosion, and then shifts to the Z-discs as the sarcomeres cease growing (arrow head). The shift in Dia localization is verified by plotting the fluorescent signals in the boxed area: day 1 (ii), day 3 (iv) and day 7 (vi). B. Quantification of Dia localization in adult flies 1–7 days after eclosion. Fluorescence intensities of Dia were measured at the Z-disc, M-line, and at the area between the two regions from immunostained images. The relative percentage of Dia signal at the Z-disc and M-line was calculated and plotted (5 flies per genotype, 3 sarcomere signal measurements per fly, n = 15 sarcomere signal measurements, **** p<0.0001).
