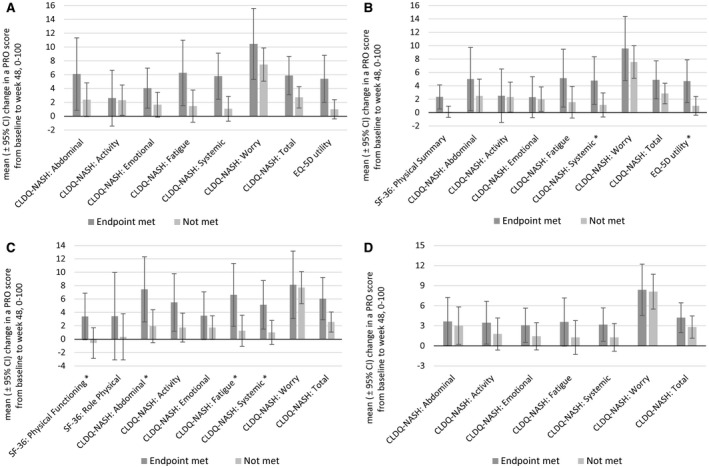
Fig. 2.

Changes in PRO scores in patients with NASH according to histologic and ELF responses. (A) Primary efficacy endpoint (≥1‐stage improvement in fibrosis without worsening of NASH); (B) ≥1‐stage improvement in fibrosis without regard to changes in NAS; (C) improvement of NAS by ≥2 points; (D) decrease in ELF score by ≥0.5 point. Additional NIT endpoints are shown in Supporting Fig. S1. Data show arithmetic mean ± 95% CI. *The difference between groups was statistically significant at P < 0.05.
