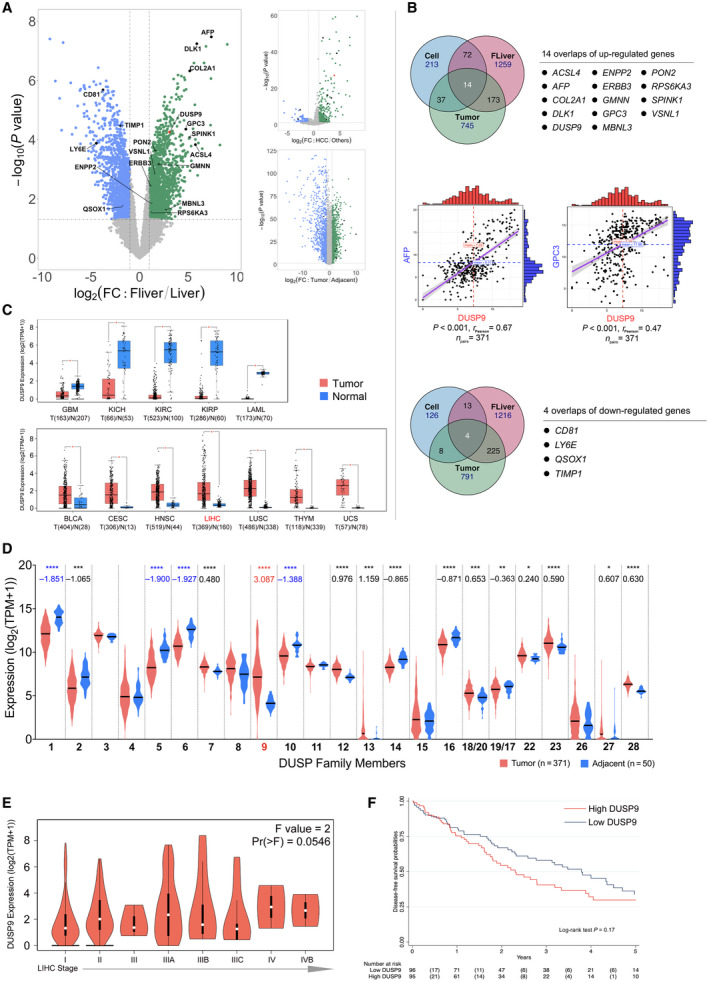
FIG. 1.

DUSP9 expression in HCC in public data sets. (A) Volcano plot of gene expression data from GSE1133 (left), NCI60_U133A_CEL (right top), and GSE25097. (B) Venn diagrams showing up‐regulated (top) and down‐regulated (bottom) genes shared by all three comparisons in (A). Correlation plots (middle) of DUSP9, AFP, and GPC3 expression in TCGA data. (C) Box plot of DUSP9 expression in different cancers; horizontal bars indicate the median, box indicates interquartile range from Q1 to Q3 with jitter size of 0.4; *P < 0.05. (D) Violin plot showing expression of DUSPs in HCC; violin plots indicate probability density and horizontal bars indicate the median; significant mean fold changes of gene expression in tumor versus adjacent are indicated below asterisks; ****P < 0.0001, ***P < 0.001, **P < 0.01, *P < 0.05. (E) Violin plot of DUSP9 expression in progressive stages of HCC; white dots indicate median, vertical black boxes indicate interquartile range from Q1 to Q3. (F) Kaplan‐Meier analysis of DFS following HCC resection in TCGA cohort according to DUSP9 expression. Abbreviations: BLCA, bladder cancer; CD81, cluster of differentiation 81; CESC, cervical cancer; COL2A1, collagen type 2 α1; DLK1, delta like non‐canonical Notch ligand 1; ERBB3, erb‐b2 receptor tyrosine kinase 3; FC, fold change; FLiver, fetal liver; GBM, glioblastoma; HNSC, head‐neck squamous cell carcinoma; KICH/KIRC/KIRP, kidney cancers: chromophobe renal cell carcinoma/clear cell renal cell carcinoma/papillary renal cell carcinoma; LAML, acute myeloid leukemia; LIHC, liver hepatocellular carcinoma; LUSC, lung squamous cell carcinoma; RPS6KA3, ribosomal protein S6 kinase A3; THYM, thymoma; TIMP1, tissue inhibitor of metalloproteinase 1; TPM, transcripts per million; UCS, uterine cancer.
