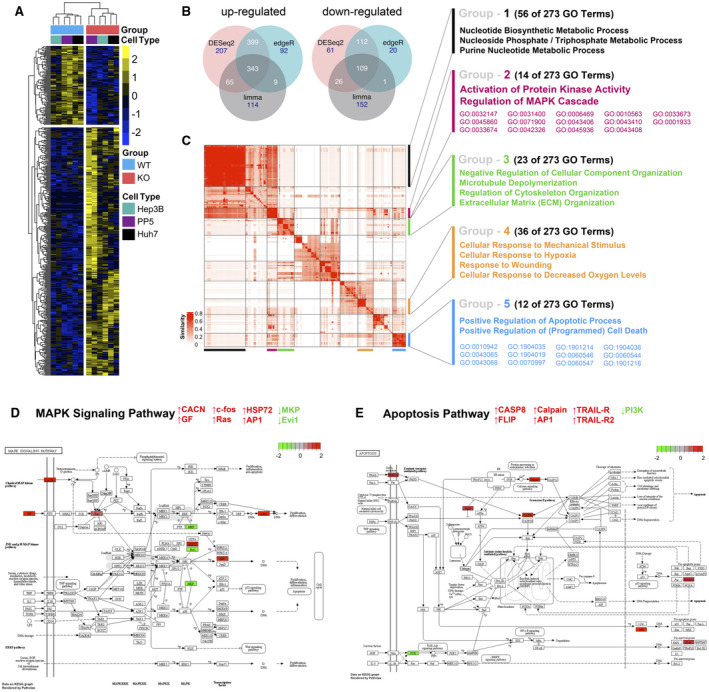
FIG. 6.

RNA‐Seq analysis of DUSP9 WT and KO HCC cells. (A) Representative heatmap of expression clustering differentiates between DUSP9 KO and WT colonies across cell lines. DUSP9 KO is associated with decreased expression of 109 genes (top) and increased expression of 343 genes (bottom) (yellow, increased expression; blue, decreased expression). (B) Venn diagrams illustrating 343 up‐regulated and 109 down‐regulated genes consistently identified by pooled analysis of RNA‐Seq data from DUSP9 KO versus WT HCC cells using the R packages DESeq2, edgeR, and limma‐voom. (C) Clustering of 273 GO terms returned by Metascape functional enrichment analysis into five major groups. (D,E) Schematic illustrations of MAPK signaling and apoptosis pathways generated by pathview, highlighting specific genes with altered expression in association with DUSP9 KO (red, up‐regulated; green, down‐regulated). Abbreviations: AP1, activator protein 1; CACN, calcium voltage‐gated channel gene group; CASP8, caspase 8; Evi1, ecotropic viral integration site‐1; FLIP, FLICE‐inhibitory protein; GF, growth factor; HSP72, heat shock protein 72; PI3K, phosphoinositide 3‐kinase; TRAIL‐R, tumor necrosis factor–related apoptosis‐inducing ligand receptor.
