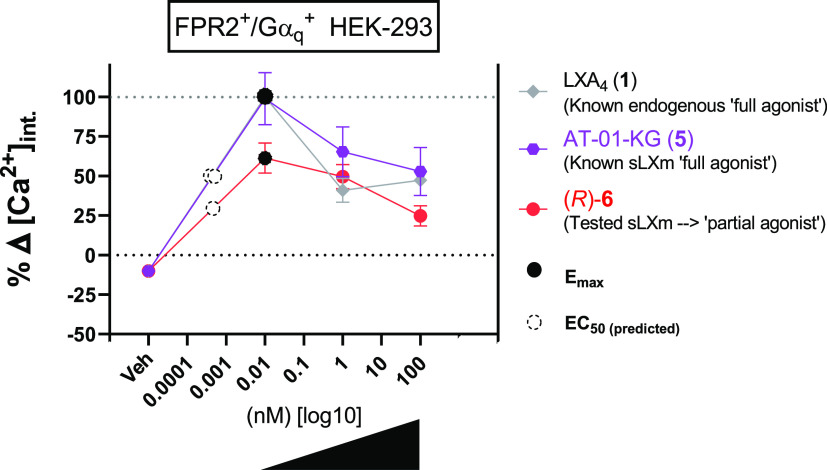
Figure 11.
Effects of (R)-6 on intracellular calcium flux in stably transfected HEK-293. Cells were cultured for 18 h prior to labeling with Fluo-4 (37 °C, 1 h). (a) Quantification of three independent experiments was carried out by calculating differential calcium signals measured at the baseline and at maximum peak. Data are expressed as % delta calcium-induced fluorescent signal relative to the peak of a known full agonist (1) ± SEM (n = 3). Concentration–response curves for LXA4 (1) and sLXms (10 pM to 100 nM) show the Emax (black circles) and predicted EC50 (white dotted circles). Statistical analyses were carried out using Student’s unpaired t-test of the tested compound vs veh (not shown).

