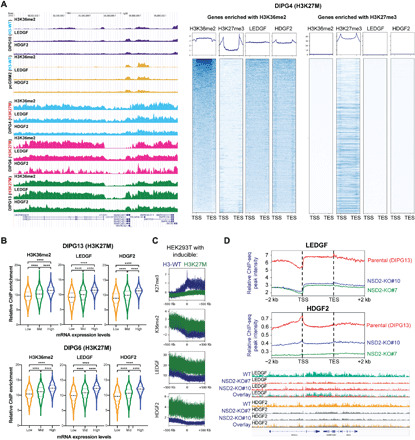
Fig. 3. LEDGF/HDGF2 occupancy on chromatin is dependent on NSD1/2-H3K36me2 and positively correlates with gene expression.

(A) Left: Representative ChIP-seq tracks of H3K36me2, LEDGF, and HDGF2 chromatin co-occupancy in H3-WT (DIPG10 and pcGBM2) and H3K27M (DIPG4, DIPG6, and DIPG13) cells. Right: Representative heatmaps of ChIP-seq for DIPG4 cells centered to H3K36me2- or H3K27me3-enriched genes. (B) Violin plots showing enrichment of H3K36me2, LEDGF, or HDGF2, respectively, for genes categorized as low, mid, or high based on their mRNA expression. The central thick dash line indicates the mean value of each plot; the upper thin dash line indicates the top 25% percentile and the lower one for the bottom 25% percentile. (C) Metaprofile plots of H3K27me3, H3K36me2, LEDGF, and HDGF2 ChIP-seq data in HEK293T cells ectopically expressing H3-WT or H3K27M for 24 hours. Data were presented within a 500-kb window upstream or downstream from TSS. (D) Top: Metaprofile plots of LEDGF and HDGF2 occupancy in WT or NSD2-KO DIPG13 cells (clone #7 and clone #10). Bottom: Representative ChIP-seq tracks for the top panel. Overlaid panels were presented at the bottom to better illustrate the differences. TSS, transcription start site; TES, transcription end site. ****P < 0.0001 by Student’s t test.
