
Fig. 2. Representative ToF-SIMS 2D (XY) maps (negative ions) of Paleoarchean filaments.
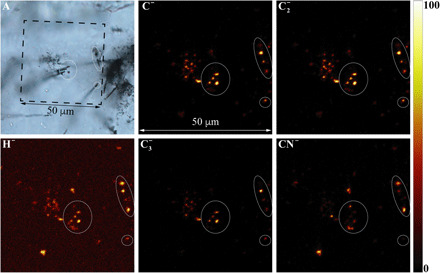
ToF-SIMS images correspond to the boxed area shown in the transmitted light optical photomicrograph (A), which captures the topmost surficial focal plane of the petrographic thin section. The ellipses shown in all images are from the same areas on the thin section where filaments clearly intersect the surface. Concentrations of carbon (C−, C2−, and C3−), nitrile (CN−), and hydrogen (H−) on the mapped surface were visibly colocated with the filaments. In the ToF-SIMS maps, brighter color indicates higher relative signal intensity of the assigned element (see also intensity column).