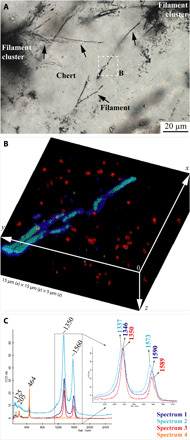
Fig. 3. Distribution of different CM types in the Paleoarchean filaments.

(A) Extended depth of field transmitted optical photomicrograph (boxed area in Fig. 1G) showing filament details. (B) 3D confocal Raman image of the different types of CM detected in association with filaments and surrounding area, corresponding to the boxed area in (A). Color coding here reflects only the different CMs distinguished by different Raman spectra in (C). Turquoise and blue indicate Raman spectra 1 and 2 in (C), respectively, which is associated with the CM of the filaments, whereas red indicates a Raman spectrum 3 in (C) for CM of the nanometric particles dispersed in the chert vein layer Ia. Brighter color corresponds to the greater peak intensity (cf. movie S1). (C) Average Raman spectra of each species analyzed in the rendered volume in (B). Magnification of the D and G band region (inset) shows spectral details where the intensity was normalized to that of the D peak (see section S5). All spectra are represented on the same intensity scale. Spectrum 4 corresponds to the matrix quartz composition. Note that the Raman signal of the chert matrix, corresponding to the Raman spectrum 4 in (C), has been removed and appears black in (B).
