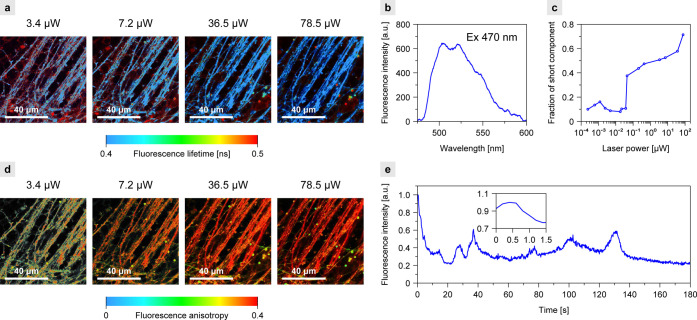
Figure 2.
Imaging and fluorescence analysis of the human retina. (a) FLIM imaging with increasing laser power. (b) Fluorescence emission spectrum of a single axon. (c) Laser power dependency of the fraction of the short-lifetime component in the experiment presented in (a). (d) Fluorescence anisotropy images corresponding to the FLIM images in (a). (e) Time course of xanthophyll fluorescence changes in a single axon at laser power 1.4 μW. Fluorescence detection started automatically by the system 1 s after the onset of laser light. The maximum signal normalized to 1. The retina from a healthy 18-year-old female donor (a–d) and a healthy 39-year-old male donor (e).

