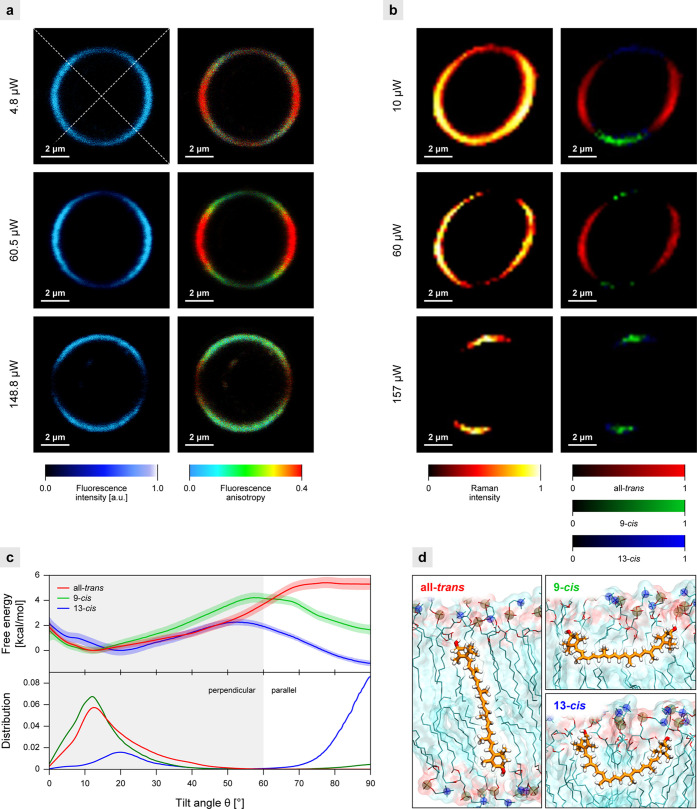
Figure 3.
Experimental and computational analyses of xanthophylls in model membranes. Images of the equatorial cross section of the lipid vesicle containing m-Zea (a) or Zea (b) recorded with increasing laser power. Imaging is based on fluorescence intensity and anisotropy (a) or Raman scattering (b). On the right-hand side of (b), results of the component analysis are shown. Molecular configurations all-trans, 9-cis, and 13-cis were identified (the component spectra are shown in Figure S5). (c) Free energy profiles (top) and the corresponding probability densities (bottom) for the tilt angle between the polyene chain and the membrane normal (see Figure S7a) for Zea all-trans and its 9-cis and 13-cis isomers in the DPPC bilayer. (d) Representative structures for the perpendicular orientation of all-trans Zea (left) and the horizontal orientations of its two cis isomers (right) in the DPPC membrane.

