Figure 6.
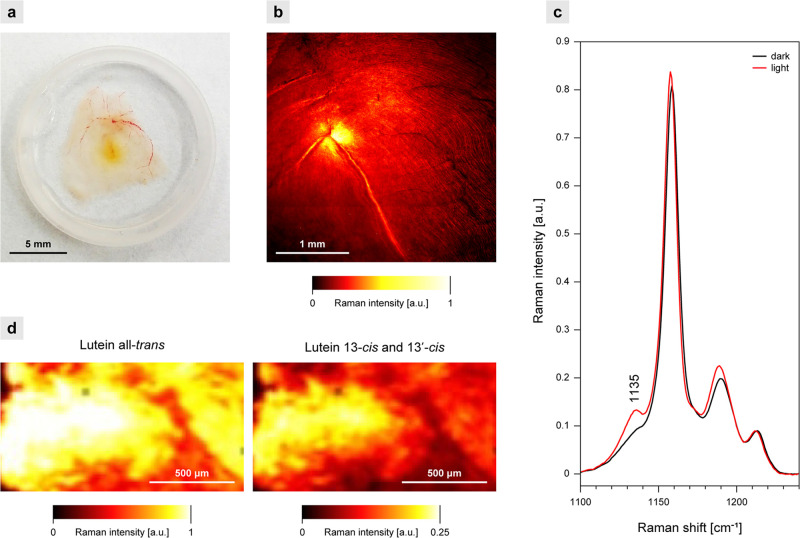
Raman analysis of the human retina. Experiments with a 488 nm laser. (a) Photo of a preparation. (b) Raman image based on the integration of the ν1 band (1500–1550 cm–1). (c) Raman spectra in the ν2 region, recorded from the neighboring parts of the macula: dark-adapted (dark) and exposed for 5 min to white light (light). Spectra represent the arithmetic mean from 20 spectra recorded at different positions. The spectra are normalized in the maximum of the ν1 band. (d) Distribution of the molecular configuration forms of Lut in the central retina exposed to light. Note different scales in the images representing the all-trans and 13-cis and 13′-cis isomers. In the case of Lut all-trans, the intensity is overestimated owing to the contribution of Zea and m-Zea to the resonance Raman spectra. The retina samples from a healthy 79-year-old female donor (a), a healthy 34-year-old female donor (b), and a healthy 18-year-old female donor (c, d).

