
Figure 7.
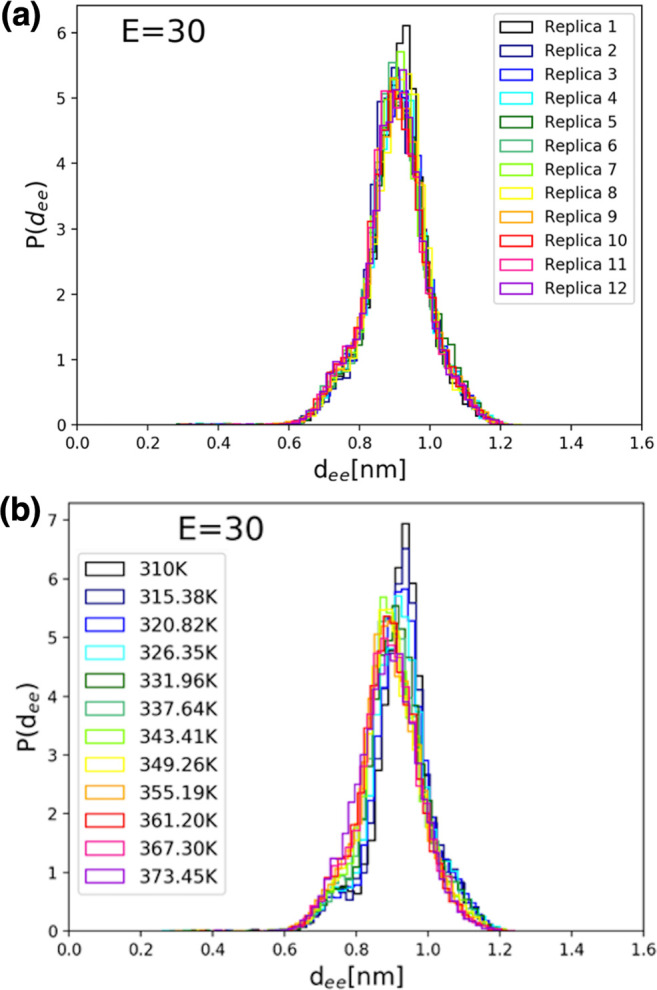
Distributions of side chain-to-side chain distances, dee, for simulations with an applied electric field of 30 kcal/(mol Å e), (a) for each replica (R-trajectories) and (b) at each temperature (T-trajectories) of the REMD simulation set. Note that, at this field intensity, the conformational dynamics is restricted to an extended structure with a most probable dee value of ∼8.9 Å.