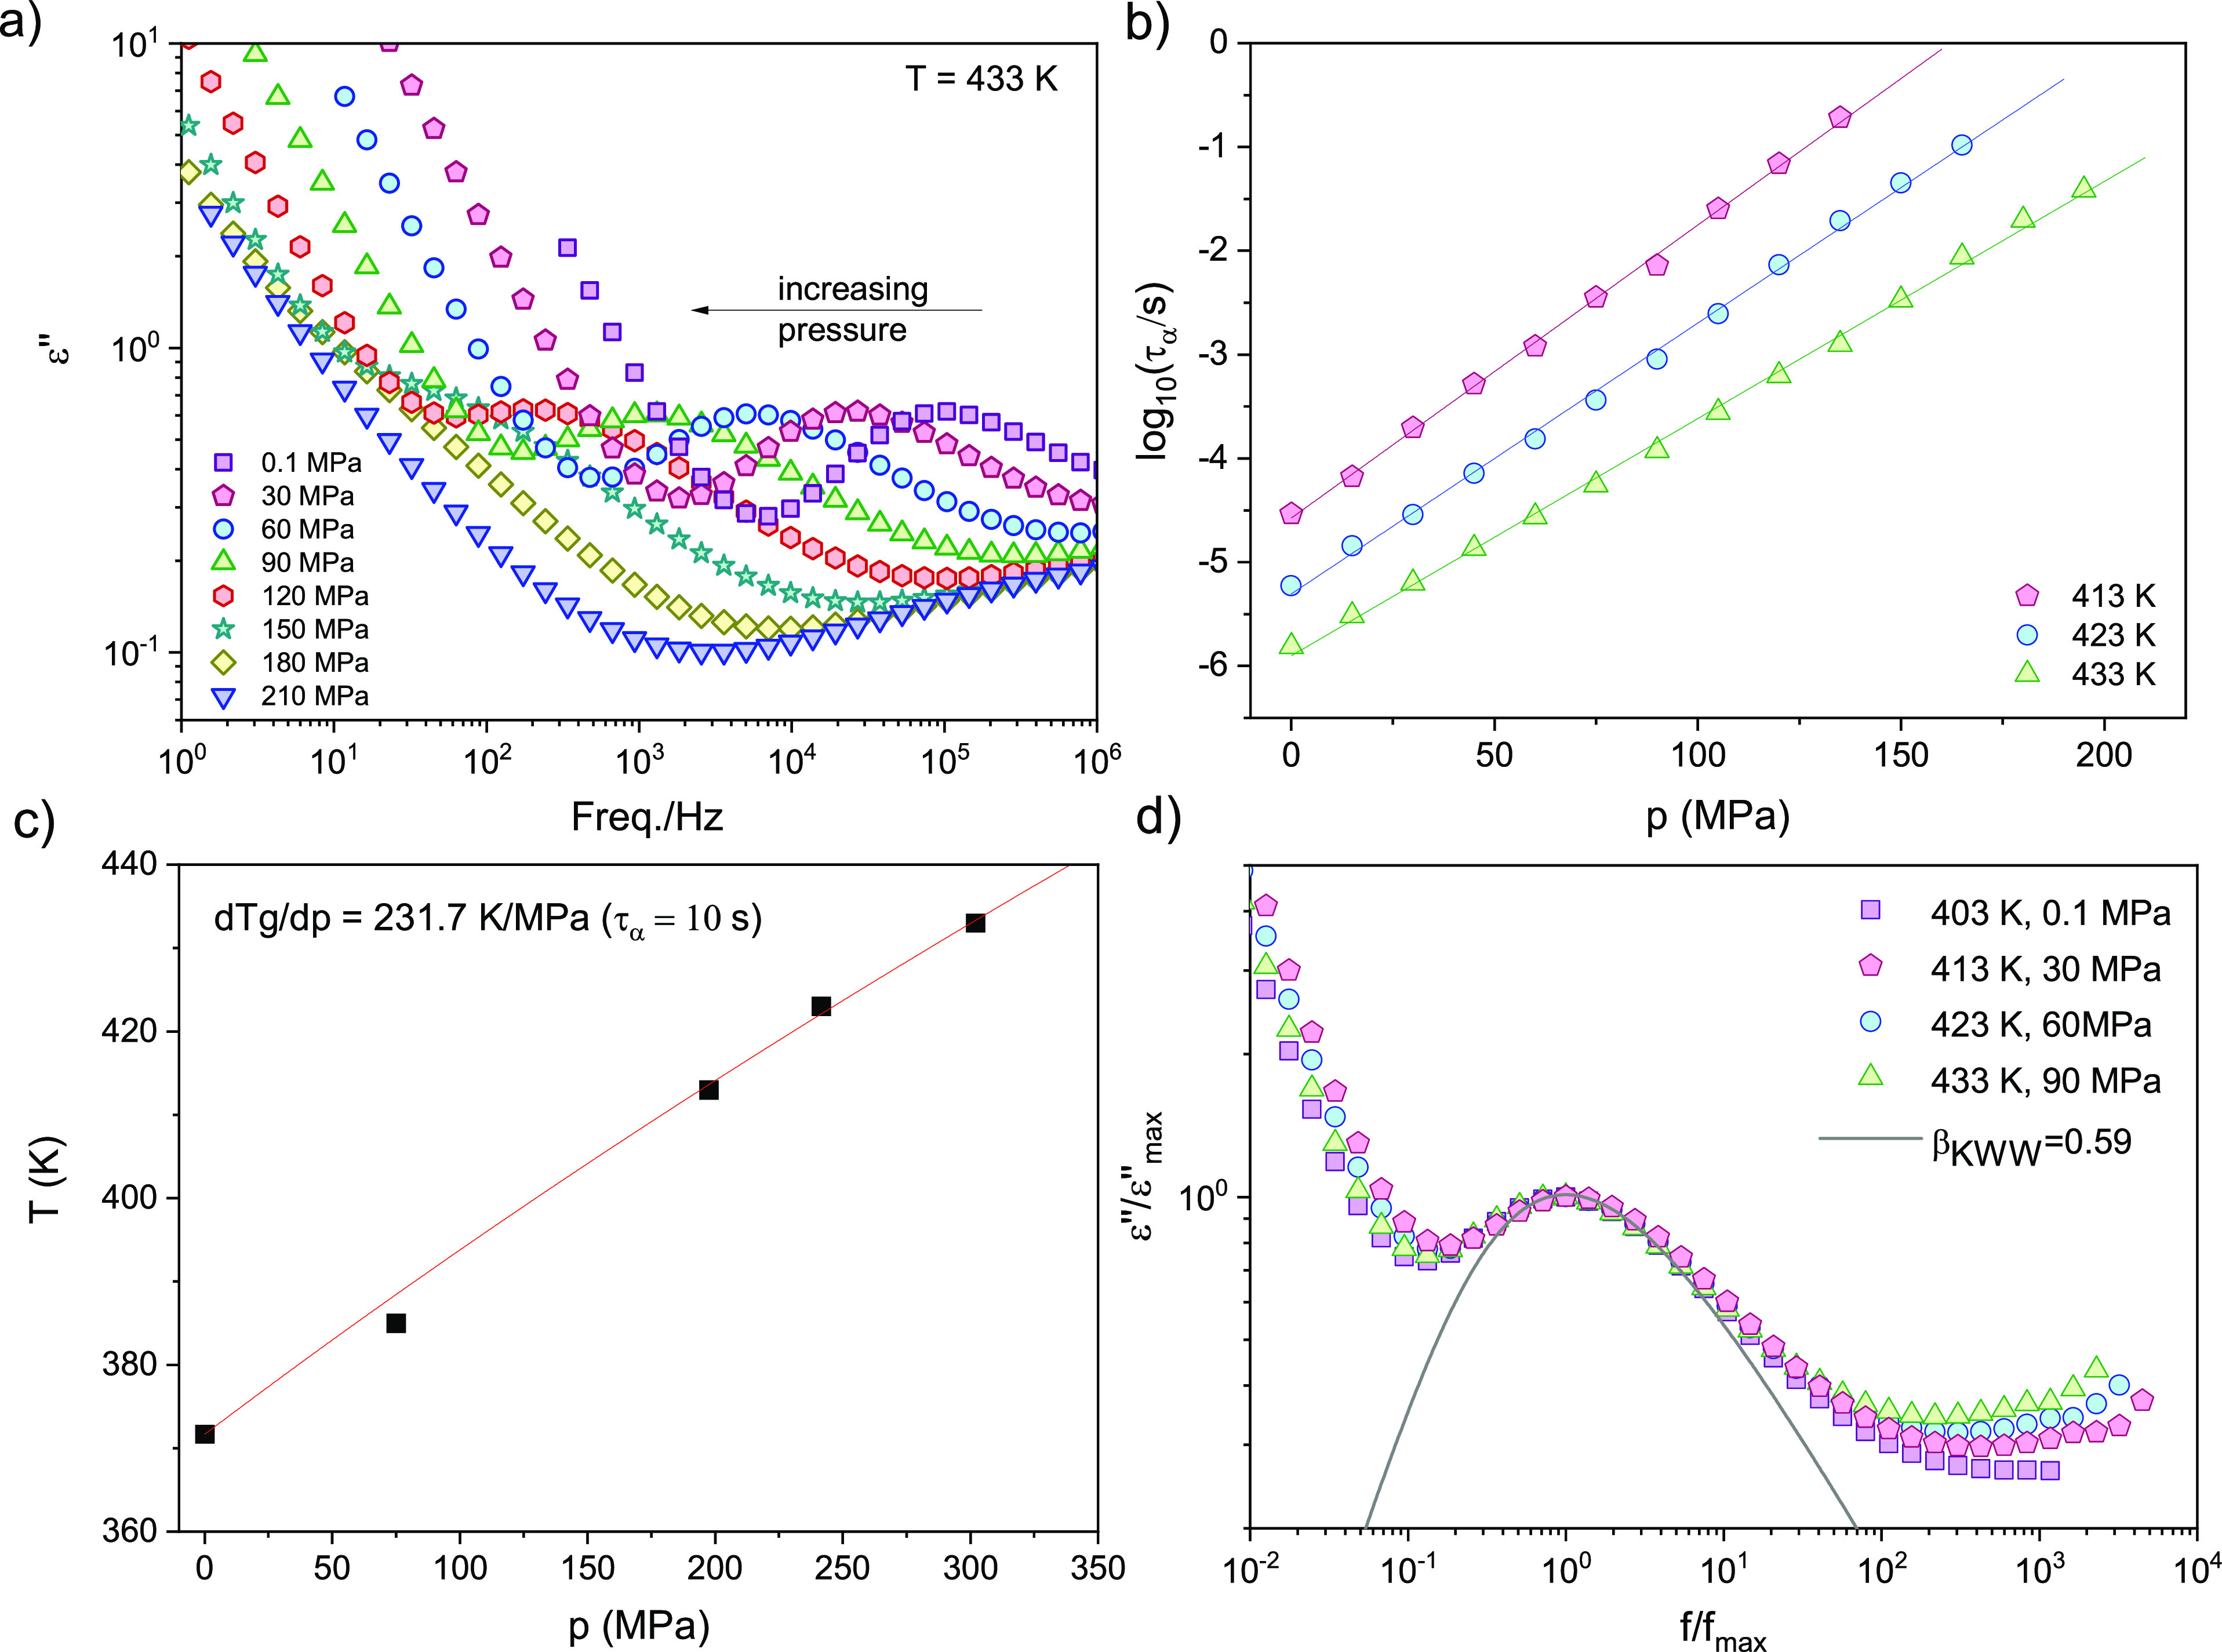
Figure 6.

(a). Dielectric loss spectra measured for bulk P2VP along isotherm T = 433 K. (b) α-Relaxation time plotted versus pressure along three different isotherms. Solid lines represent fit to the data with the use of the pressure version of the Arrhenius equation. (c) Variation of the glass transition temperature as a function of pressure. The glass transition was determined from dielectric data as the temperature (pressure) at which τα = 10 s. The red line represents the Andersson–Andersson fit. (d). Comparison of the normalized dielectric loss spectra obtained at different thermodynamic conditions (T, p) for approximately the same α-relaxation time (so-called isochronal superposition plot).
