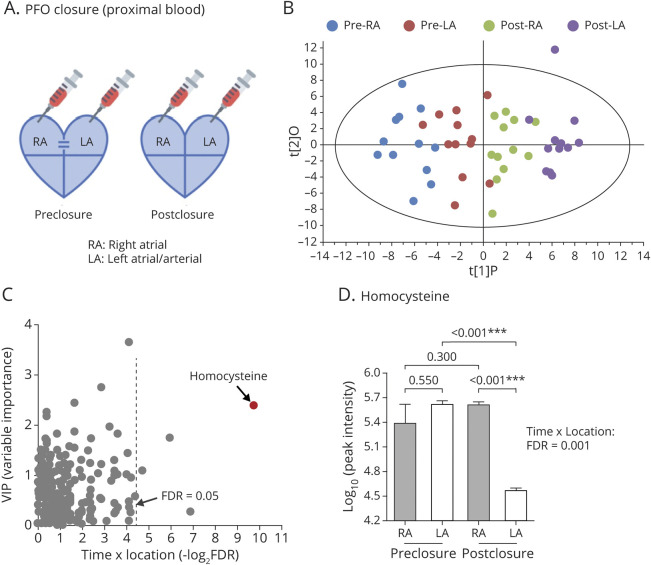
Figure 1. Metabolite Profiling in Discovery Patent Foramen Ovale (PFO) Closure Patient Cohort (n = 12).
(A) Diagram of blood sampling during PFO closure. (B) Scatterplot of orthogonal projections to latent structures-discriminant analysis (OPLS-DA) score for the metabolites identified in pre–right atrium (RA), pre–left atrium (LA), post-RA, and post-LA. (C) Scatterplot of variable importance for projection (VIP) values from OPLS-DA vs log-transformed false discovery rate (FDR) from 2-way repeated-measures analysis of variance. (D) Peak intensity of homocysteine with pairwise comparisons. *p < 0.05; **p < 0.01; ***p < 0.001.

