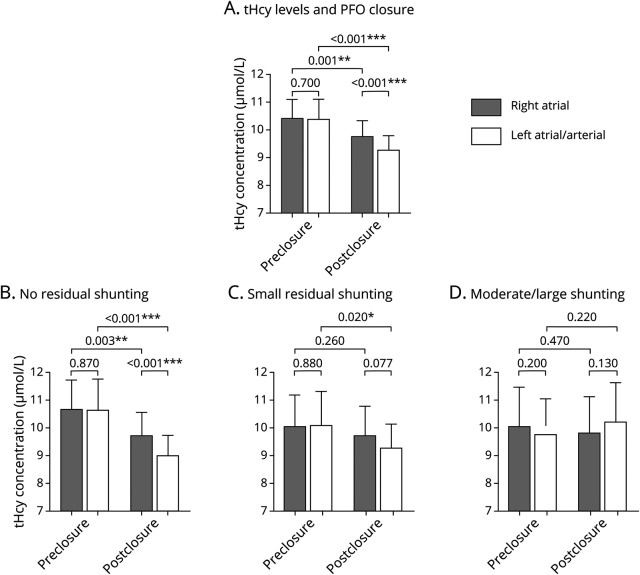
Figure 2. Immediate Effect of Patent Foramen Ovale (PFO) Closure on Intracardiac Total Homocysteine (tHcy) Levels (Validation Cohort).
(A) tHcy levels in pre–right atrium (RA), pre–left atrium (LA), post-RA, and post-LA were plotted for all patients receiving PFO closure (n = 181). (B–D) tHcy levels in patients with no residual shunting (n = 101), small residual shunting (n = 55), and moderate/large residual shunting (n = 25) post closure. Values are expressed as mean ± 95% confidence interval. Two-way repeated-measures analysis of variance was used to compare tHcy levels in each cardiac atrium followed by pairwise comparisons. *p < 0.05; **p < 0.01; ***p < 0.001.

