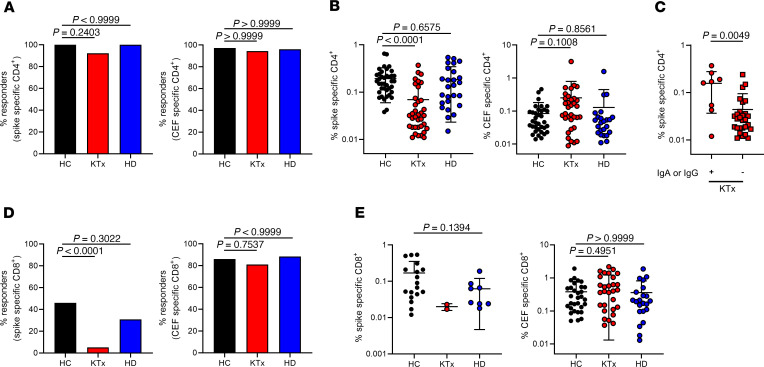
Figure 2. Quantitative features of spike-reactive T cells.
(A) PBMCs were stimulated with spike (left) or CEF (right) peptide mix for 16 hours, as indicated. Specific CD4+ T cells were identified and quantified by FACS based on coexpression of CD154 and CD137. Depicted are percentages of HCs (n = 39), KTx recipients (n = 39), and HD patients (n = 26) with positive CD4+ T cell responses (responders: Fisher’s exact test, respectively). (B) Frequencies of specific Th cells within responders. HC: spike, n = 39; CEF, n = 35; KTx: spike, n = 36; CEF, n = 34; HD: spike, n = 26; CEF, n = 24. Kruskal-Wallis test. (C) Portions of spike-specific Th cells in KTx patients showing IgA and/or IgG responses (+, n = 8) or not (–, n = 31; Mann-Whitney U test) until day 23 ± 5. (D) Antigen-specific CD8+ T cells were identified within PBMCs based on coexpression of CD137 and IFN-γ. Depicted are percentages within HCs (n = 39), KTx recipients (n = 39), and HD patients (n = 26) with positive CD8+ T cell responses (responders) toward spike (left, Fisher’s exact test) or CEF (right, Fisher’s exact test) stimulation. (E) Frequencies of spike-specific (left, Mann-Whitney U test) or CEF-specific CD8+ T cells (right, Kruskal-Wallis test) within responders. HC: spike, n = 18; CEF, n = 31; KTx: spike, n = 2. CEF, n = 30; HD: spike, n = 8; CEF, n = 22. Graphs show mean ± SD.

