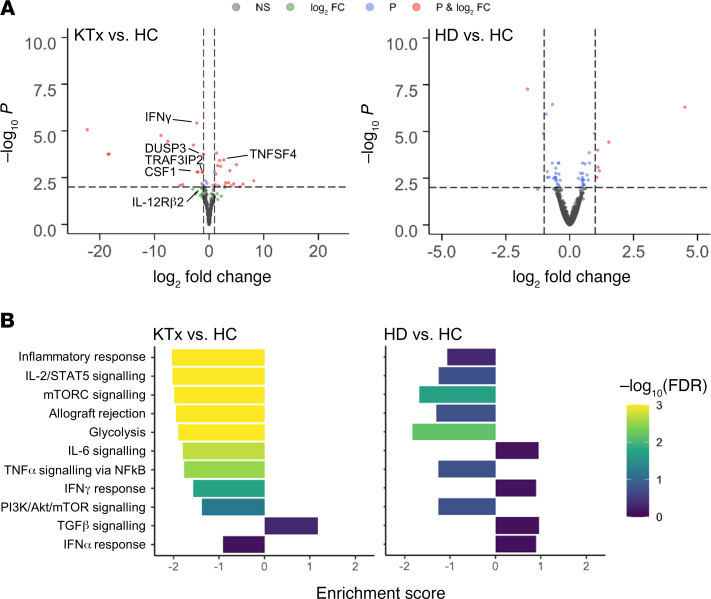
Figure 5. Analysis of differentially expressed genes in vaccine-specific Th cells.
(A) Volcano plots depicting the –log10 FDR value and log2 fold changes of all expressed genes for comparisons of KTx patients vs. HCs (left) and HD patients vs. HCs (right). Thresholds for the FDR of 0.01 (P) and for the absolute log2 fold change of 1 are indicated by dotted lines; genes passing 0 (NS – not significant), 1, or both filters are color coded. Exemplary genes involved in cellular activation are annotated. (B) Enrichment scores and FDR values for different hallmark gene sets. Direction of the enrichment scores indicates up- or downregulation in the respective comparison. KTx, n = 3; HD, n = 4; HCs, n = 4.

