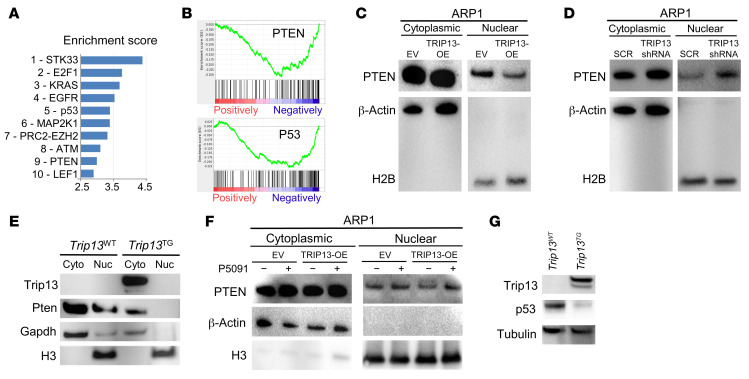
Figure 5. TRIP13 dysregulates other USP7 targets.
(A and B) Gene set enrichment analysis (GSEA) of the 1900 most significantly differentially expressed genes in comparison of Eμ-Myc/Trip13TG and Eμ-Myc/Trip13WT B cells, showing a bar view of the top 10 pathways (A) and an enrichment plot for PTEN (top plot) and p53 pathways (bottom plot) indicating suppression of these pathways when Trip13 is overexpressed (B). (C and D) Western blot analysis of PTEN, β-actin, and histone 2B (H2B) from nuclear and cytosolic fractions of EV and TRIP13-OE ARP1 cells (C) and ARP1 cells stably transduced with SCR and TRIP13 shRNA after 72 hours of induction with DOX (D). (E) Western blot analysis of Trip13, Pten, Gapdh, and histone 3 (H3) from nuclear and cytosolic fractions of thymus from Trip13TG and Trip13WT mice. (F) Western blot analysis of PTEN, β-actin, and H3 in nuclear and cytosolic fractions from EV and TRIP13-OE ARP1 MM cells treated with 16 μM P5091 for 5 hours. (G) Western blot analysis of Trip13, p53, and tubulin in thymus tissues from Trip13TG and Trip13WT mice.

