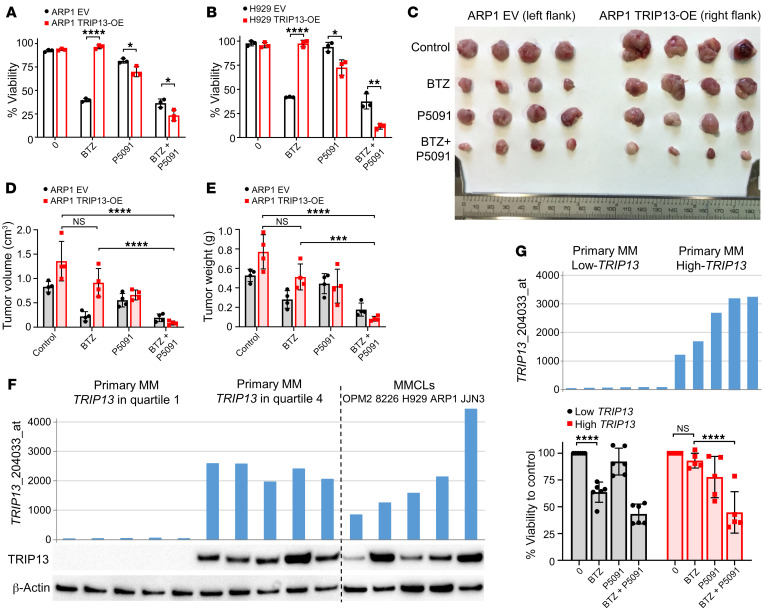
Figure 7. The USP7 inhibitor P5091 reduces TRIP13-induced BTZ drug resistance in MM.
(A and B) ARP1 (A) and H929 (B) EV and TRIP13-OE cells treated with or without 10 nM BTZ or 10 μM P5091 alone or in combination for 48 hours followed by cell viability determination by trypan blue staining (n = 3 per condition). (C) ARP1 EV and TRIP13-OE cells (~0.5 × 10⁶ cells per injection) were injected into the left and right flanks, respectively, of NSG mice. Mice were treated with vehicle control, BTZ (1 mg/kg, i.p., twice a week from day 7), P5091 (10 mg/kg, i.v., twice a week from day 3), and a combination. Mice were sacrificed and tumors were dissected and photographed by week 3 (n = 4 per group). (D and E) Tumor volume (D) and tumor weight (E) were measured and quantified from C. (F) TRIP13 gene expression signal is plotted on the y axis. Primary MM with TRIP13 expression in quartile 1 (n = 5) and quartile 4 (n = 5) and MM cell lines (MMCLs, n = 5) are grouped and plotted along the x axis. Corresponding TRIP13 and β-actin protein levels were analyzed from cell lysates of aliquot CD138-positive cells and MMCLs by Western blot. (G) TRIP13 gene expression signal of primary MM with low TRIP13 expression in quartile 1 (n = 6) and high TRIP13 expression in quartile 4 (n = 5) is plotted on the y axis. Corresponding CD138-positive cells were treated with or without 5 nM BTZ or 2.5 μM P5091 alone or in combination for 24 hours followed by cell viability determination by trypan blue staining. One high-TRIP13 sample was excluded because of low cell viability after thawing. Data are represented as mean ± SD. *P ≤ 0.05, **P ≤ 0.01, ***P ≤ 0.001, ****P ≤ 0.0001 by Student’s t test in A and B and by Tukey’s test for multiplicity-adjusted P values in D, E, and G.

