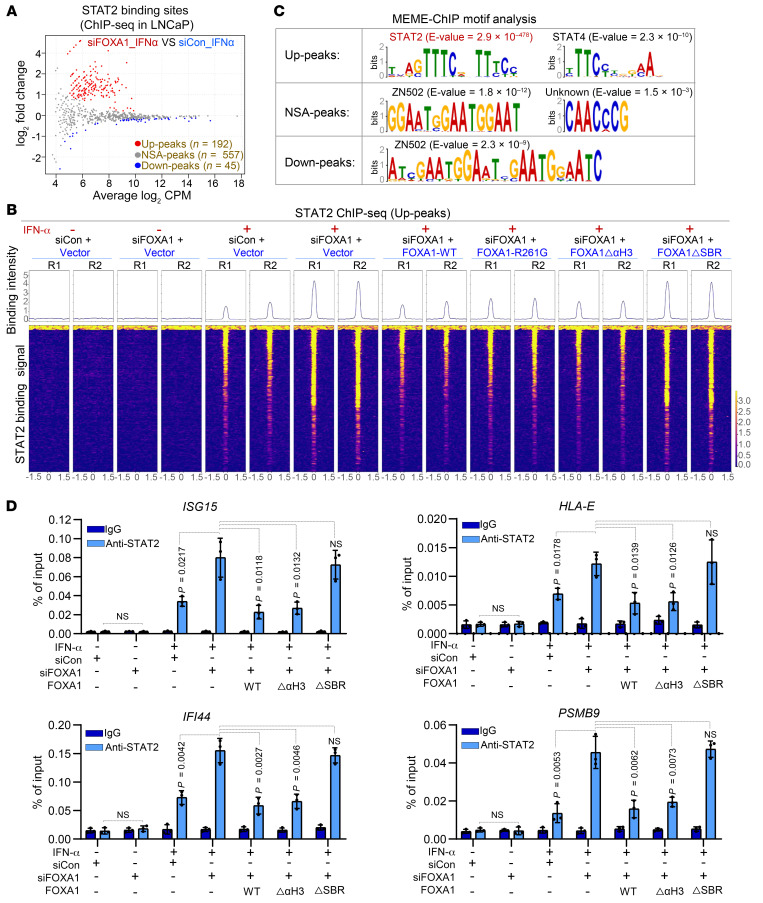
Figure 3. The effect of FOXA1 on STAT2 cistrome in PCa cells.
(A) MA plot of STAT2 ChIP-seq data in LNCaP cells transfected with control (siCon) or FOXA1-specific siRNAs in the presence or absence of IFN-α treatment. Red dots (Up-peaks) and blue dots (Down-peaks) represent increased and decreased peaks (FDR < 0.05), respectively, and gray dots indicate peaks with no significant alterations (NSAs) (FDR > 0.05) after FOXA1 KD. (B) Heatmaps show the signaling intensity of 192 STAT2 ChIP-seq Up-peaks in LNCaP cells under the indicated cellular conditions. (C) MEME-ChIP DNA motif analysis in 192 STAT2 ChIP-seq Up-peaks, 557 NSA-peaks, and 45 Down-peaks caused by FOXA1 KD in LNCaP cells. (D) ChIP-qPCR analysis of STAT2 occupancy at genomic loci of STAT2 target genes ISG15, IFI44, HLA-E, and PSMB9 under the indicated cellular conditions. Data shown as mean ± SD (n = 3). Statistical significance was determined by 1-way ANOVA with Bonferroni’s correction for multiple tests.

