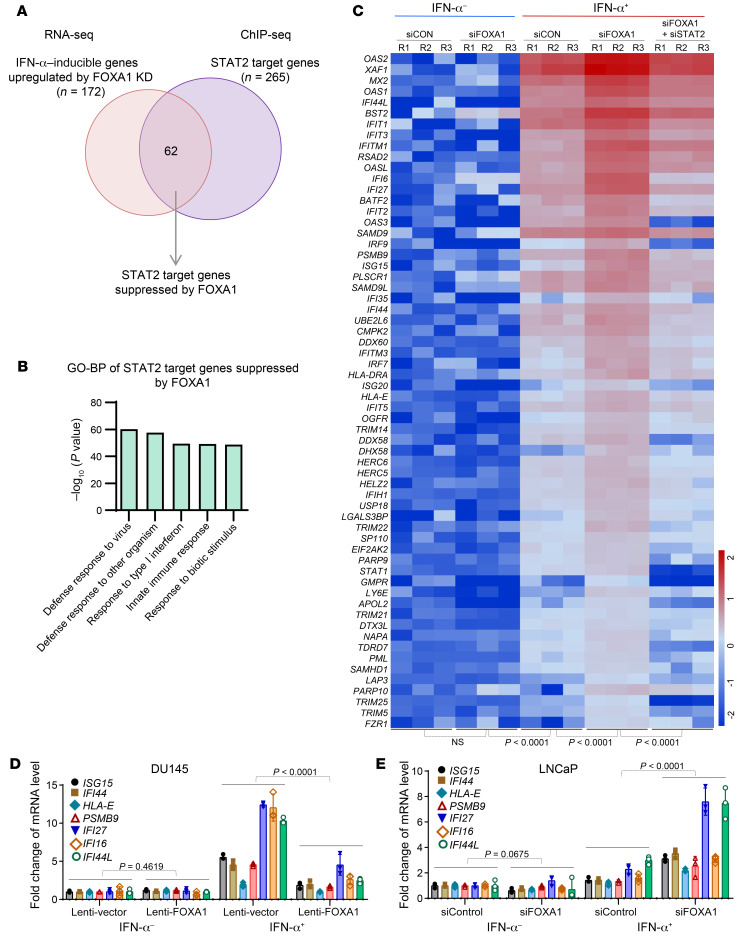
Figure 4. Identification of IFN-α response genes suppressed by FOXA1.
(A) Venn diagram showing the overlap of IFN-α–stimulated genes upregulated by FOXA1 KD with the STAT2 target genes identified by STAT2 ChIP-seq. (B) GO-BP pathway analysis of the 62 STAT2 target genes suppressed by FOXA1. (C) Heatmap shows the differential expression of the 62 STAT2 target genes suppressed by FOXA1 in LNCaP cells under the indicated cellular conditions. (D and E) RT-qPCR analysis of expression of STAT2 target genes ISG15, IFI44, HLA-E, PSMB9, IFI27, IFI16, and IFI44L in FOXA1-negative DU145 cells infected with lentivirus expressing vector or FOXA1 (D) and in FOXA1-high LNCaP cells transfected control or FOXA1-specific siRNAs (E). Data shown as mean ± SD (n = 3). Statistical significance was determined by 1-way ANOVA.

