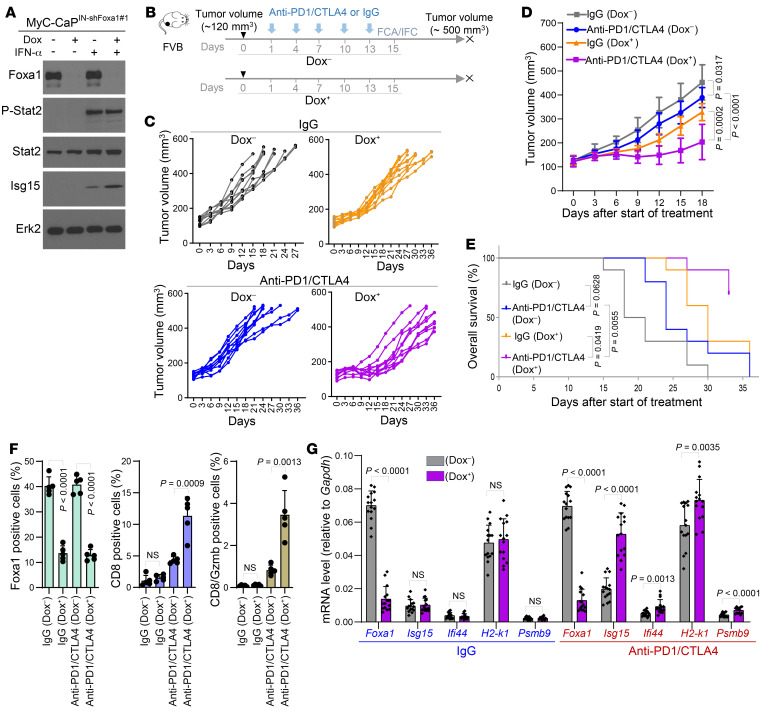
Figure 6. Foxa1 knockdown sensitizes murine PCa to anti–PD-1 and anti-CTLA4 combination therapy.
(A) Western blot analysis of indicated proteins in MyC-CaP murine PCa cells stably expressing doxycycline-inducible lentiviral shFoxa1#1 (MyC-CaPIN-shFoxa1#1) and treated with or without doxycycline (Dox) or/and IFN-α. Erk2 served as a loading control. (B) Schematic diagram of generation and anti–PD-1/anti-CTLA4 treatment of MyC-CaPIN-shFoxa1#1 prostate tumors in syngeneic mice. Dox–, without doxycycline treatment; Dox+, with doxycycline treatment; FCA, flow cytometric analysis; IFC, immunofluorescent cytochemistry. (C and D) Growth of MyC-CaPIN-shFoxa1#1 prostate tumors treated with IgG or combination of anti–PD-1/anti-CTLA4 at the indicated time points (arrowheads) in FVB mice (n = 10 mice/group). Statistical significance was determined by 2-way ANOVA. (E) Tumor-free survival of syngeneic mice bearing MyC-CaPIN-shFoxa1#1 prostate tumors treated with IgG or anti–PD-1/anti-CTLA4 (n = 10 mice/group). Statistical significance was determined by log-rank (Mantel-Cox) test. (F) Flow cytometric analysis of Foxa1-, CD8-, and Gzmb-positive cells in MyC-CaPIN-shFoxa1#1 tumors from mice 2 days after the last administration of IgG or anti–PD-1/anti-CTLA4. Data are shown in the bar graphs as mean ± SD (n = 5 mice/group). Statistical significance was determined by 1-way ANOVA with Bonferroni’s correction for multiple tests. (G) RT-qPCR analysis of Foxa1 and murine Stat2 target genes Isg15, Ifi44, H2-k1, and Psmb9 in MyC-CaPIN-shFoxa1#1 tumors from mice 2 days after the last administration of IgG or anti–PD-1/anti-CTLA4. The data are presented as the mean ± SD (n = 5 mice/group). Statistical significance was determined by 1-way ANOVA with Bonferroni’s correction for multiple tests.

