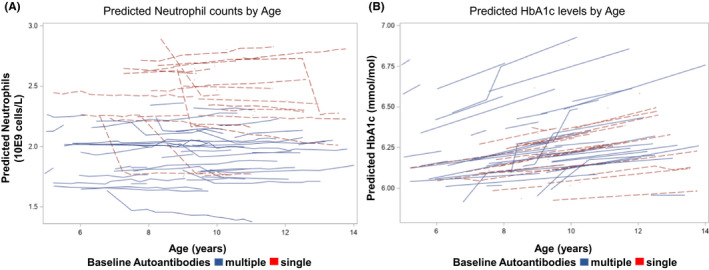
FIGURE 2.

Predicted trajectories from the mixed models analysis for neutrophils (A) and HbA1c (B) stratified by the number of islet autoantibodies (single or multiple ≥2 islet autoantibodies) at initial observation. Each trajectory represents a single subject
