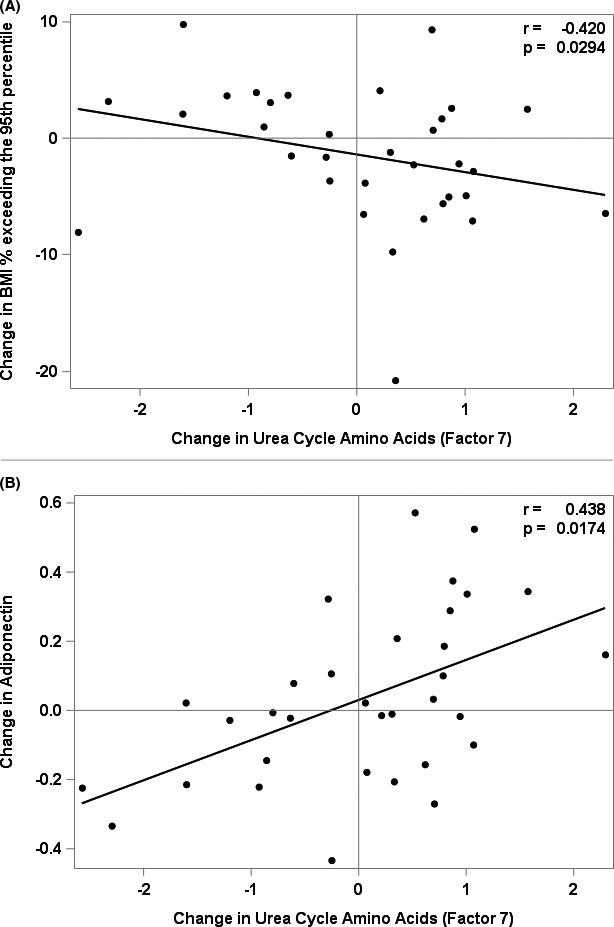
FIGURE 2.

Associations between change in Urea Cycle Amino Acids, and change in BMI% exceeding the 95th percentile and change in Adiponectin, r is the partial Pearson correlation coefficient adjusted for Sex, Age, BMI z‐Score and selected significant factors. (A) Associations between change in BMI% exceeding the 95th percentile and change in Urea Cycle Amino Acids (Factor 7). (B) Associations between change in adiponectin and change in Urea Cycle Amino Acids (Factor 7)
