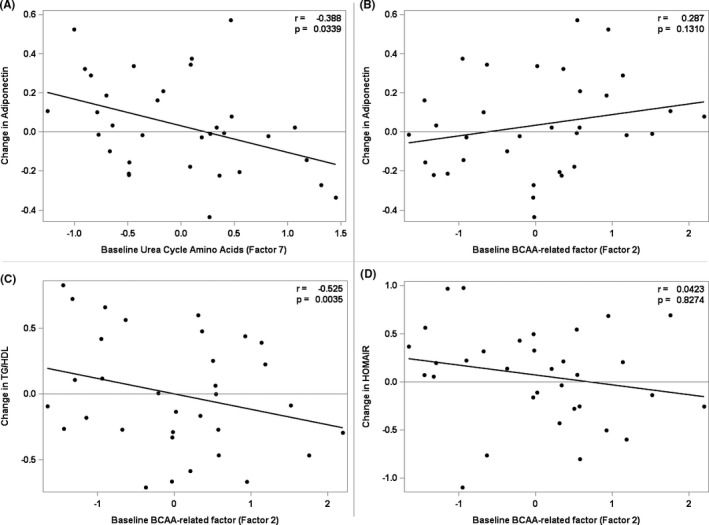
FIGURE 3.

Prediction of surrogate measures of insulin sensitivity with baseline factors, r is the partial Pearson correlation coefficient adjusted for Sex, Age, BMI z‐Score and selected significant factors. (A) Prediction of insulin sensitivity assessed by change in adiponectin with baseline Urea Cycle Amino Acids (Factor 7). (B) Prediction of insulin sensitivity assessed by change in adiponectin with baseline BCAA‐related factor (Factor 2). (C) Prediction of insulin sensitivity assessed by change in TG/HDL with baseline BCAA‐related factor (Factor 2). (D) Prediction of insulin sensitivity assessed by change in HOMA‐IR with baseline BCAA‐related factor (Factor 2)
