FIGURE 1.

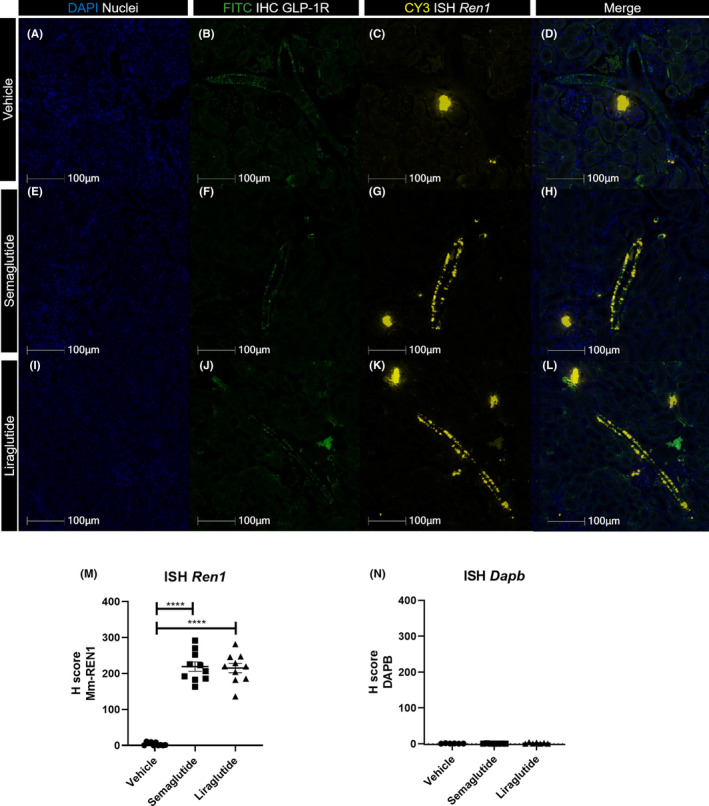
Expression of Ren1 four hours post single injection in mouse kidney. (A‐L) Panel showing representative photos from Ren1 in situ hybridization and GLP‐1R IHC double stain, from C57BL/6 J mice injected with a single dose of vehicle (top row), semaglutide (second row) or liraglutide (third row). DAPI nuclear stain (blue, first column), GLP‐1R IHC stain labelled with FITC (green, second column), Ren1 ISH labelled with CY3 (yellow, column three), and merge of all three stains (Last column). Scale bars 100 µm, 40× magnification. (M) Quantification of Mm‐Ren1 detection in renal vasculature from mice injected with vehicle (●), semaglutide (■) or liraglutide (▲). Individual values represent mean of 6–9 arteries. Data shown as individual values, mean and SEM. Analysed by Brown‐Forsyth and Welch ANOVA followed by Games‐Howell's test for multiple comparisons, ****p < .0001. (N) Dapb stain as negative control from vehicle injected (●), semaglutide injected (■) and liraglutide injected (▲) mice. Individual values represent mean of 6–9 arteries. Data shown as individual values, mean and SEM
