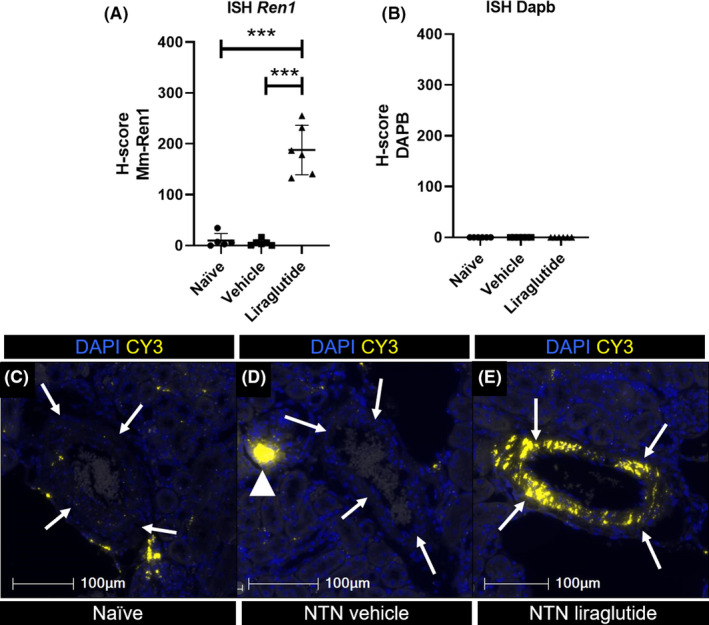
FIGURE 2.

Ren1 ISH from repeatedly injected mice. (A) Quantification of ISH of Ren1 from Naïve mice with no treatment injection (●), vehicle treated NTN mice (■) and NTN mice treated with liraglutide for 26 days (▲). Individual values represent the mean of 5–6 selected arteries. Data shown as individual values, mean and SEM ***p ≤ .005. Brown‐Forsythe and Welch ANOVA test with Holm‐Sidak's multiple comparisons test. (B) Negative control of ISH using DAPB from naïve (●), vehicle treated NTN mice (■) and NTN mice treated with liraglutide for 26 days (▲). (C–E) Representative images of artery (white arrows) and Ren1 in macula densa (white arrow‐head) from naïve (C), NTN dosed vehicle treated animals (D) and NTN dosed liraglutide treated animals (E). ISH of Ren1 in CY3 (yellow) merged with nuclear stain DAPI (blue). 40× magnification, scale bar: 100 µm. NTN, nephrotoxic nephritis
