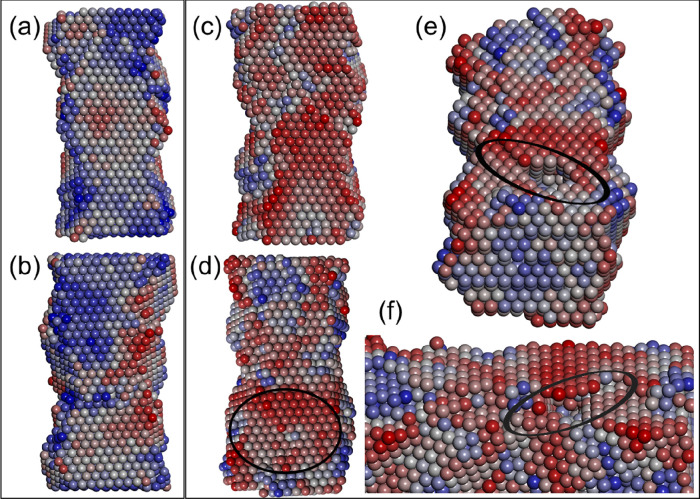
Figure 9.
Activity maps of a ceria nanorod, with [211] growth direction, with and without voids. Only oxygen atoms are displayed and colored according to their Madelung energy by using a red–white–blue sliding scale where red indicates oxygen that is energetically easy to extract and blue indicates oxygen atoms that are difficult to extract. The nanorod is composed of two large {111} surfaces shown in (a) and (b) for the nanorod without voids and (c) and (d) for the nanorod containing voids. (e) and (f) are views of a void close to the surface shown in (d); atoms were removed to show the void, and ovals indicate the position of the subsurface void.

