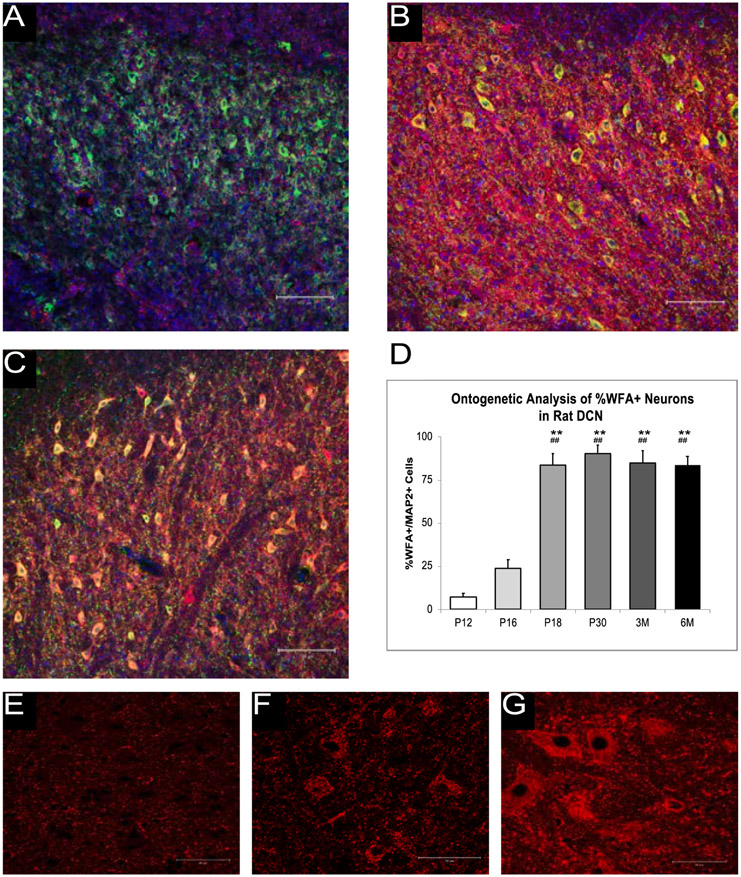
Fig. 1.
Ontogeny of the PNN in the AIN. A-C. shows the WFA reactivity (red), DAPI (blue), and MAP2 reactivity (green) in the rat AIN at P12 (A), P18 (B), and P30 (C) at 20x. D. shows the WFA reactivity at the studied ontogenetic timepoints. There is an increase in the WFA reactivity between P12 and P18 but no significant changes found after this point. E-G show WFA reactivity alone at P12 (E), P30 (F), 3 months (G) at 63x. ** = p < .01 at P12, ## = p < .01 at P16.

