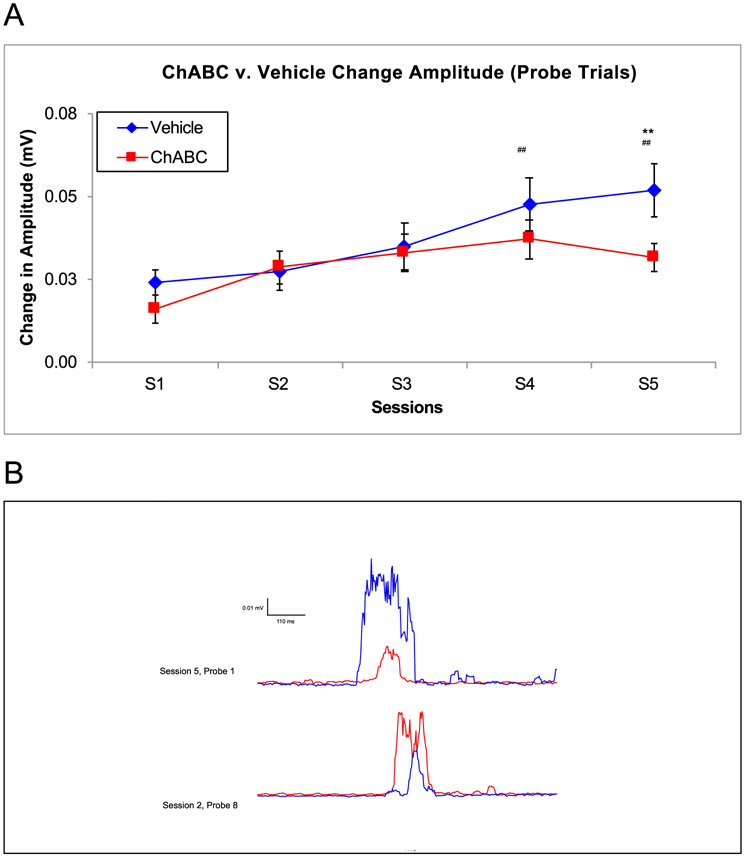
Fig. 5.
Amplitude of the Conditioned Response between ChABC and Vehicle Rats. A. On S5, the vehicle group had a noticeably higher amplitude on the final acquisition session. There were also significant session differences on S4 and S5 showing the amplitude size significantly increased over the acquisition period. B. the amplitude of a vehicle and ChABC infused rat changed from S3 (bottom traces) to S5 (top trace). ## = p < .05 for session, ** = p < .01.

