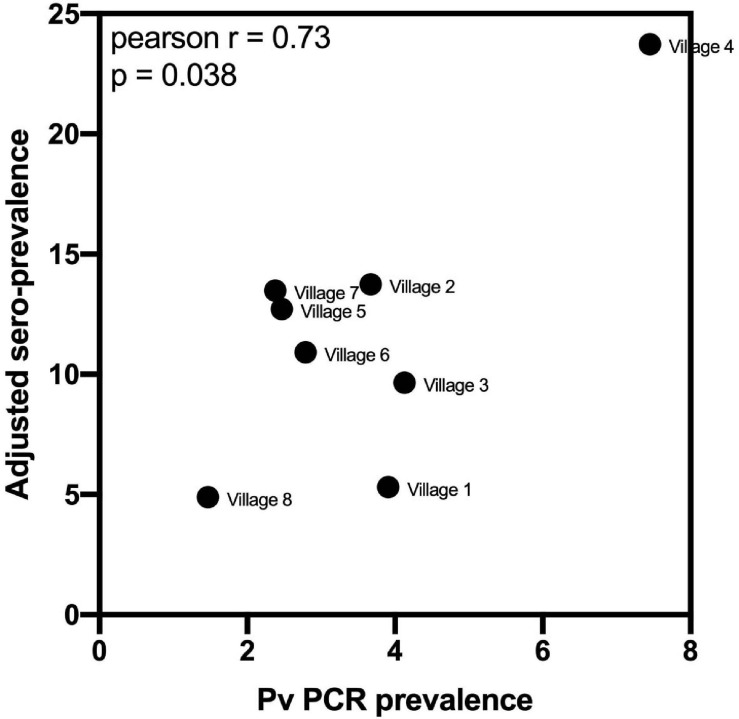
FIGURE 6.
Association between village-level PCR prevalence and adjusted P. vivax sero-prevalence. P. vivax sero-prevalence was predicted by the algorithm incorporating antibody responses to the panel of eight P. vivax proteins, using the 62% sensitivity, 90% specificity target. The estimates were adjusted, at the village-level, for to account for the known sensitivity and specificity. A Pearson r correlation was performed to assess the association between PCR prevalence and adjusted P. vivax sero-prevalence. Data passed the Anderson–Darling test for normality.

