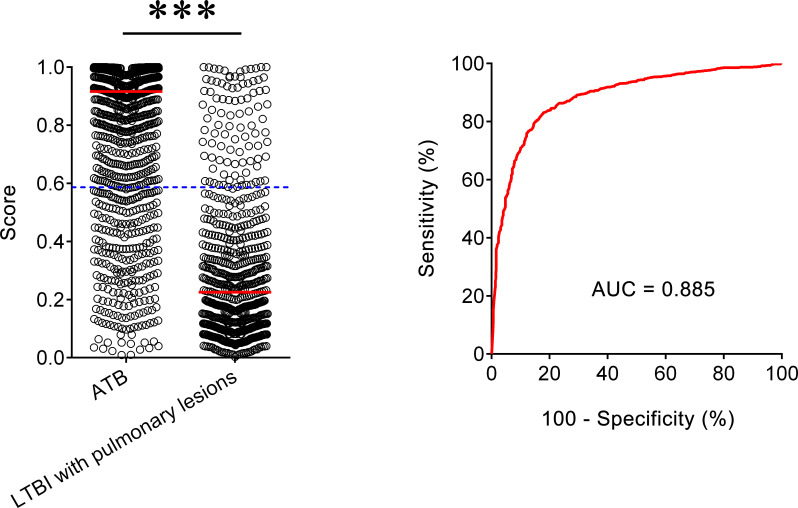
Figure 3.
The performance of established model for discriminating ATB from LTBI with pulmonary lesions. Scatter plots showing the score of the diagnostic model in ATB patients (n = 1,097) and LTBI individuals with pulmonary lesions (n = 671). Horizontal lines indicate the median. ***P < 0.001 (Mann-Whitney U test). Blue dotted lines indicate the cutoff value in distinguishing these two groups. ROC analysis showing the performance of the diagnostic model in distinguishing ATB from LTBI with pulmonary lesions. ATB, active tuberculosis; LTBI, latent tuberculosis infection; AUC, area under the curve.

