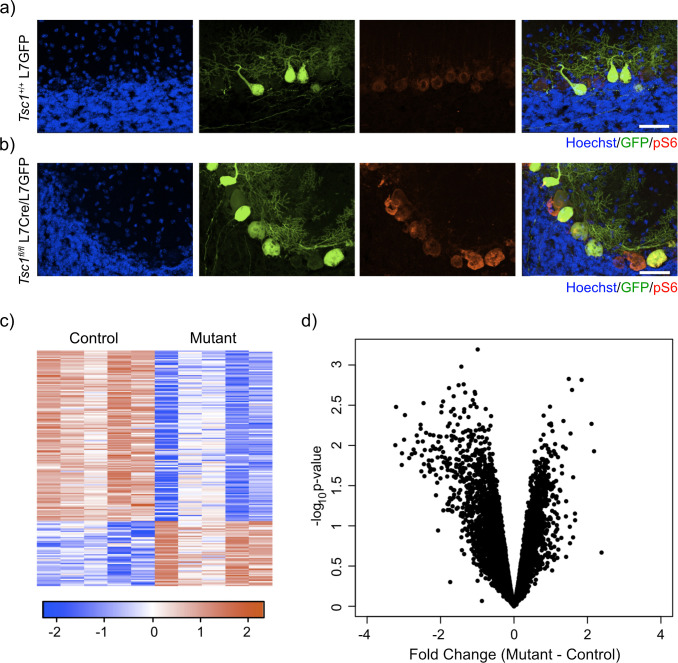
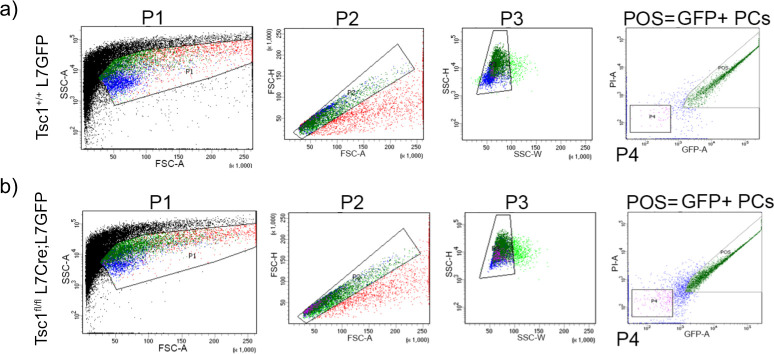
Figure 1. Labeling and sorting Tsc1fl/fl PCs show predominance of downregulation gene expression.
(a) Immunocytochemical characterization of wild-type control L7-GFP+ mouse PCs on P21 mouse cerebellum. Cell nuclei were stained with Hoechst. GFP+ PCs had dim expression of phosphorylated S6 (red). Scale bar 50 μm. (b) Immunocytochemical characterization of Tsc1fl/fl L7Cre+L7-GFP+ mouse PCs on P21 mouse cerebellum. Cell nuclei were stained with Hoechst. GFP+ PCs were strongly positive for pS6 (red). Scale bar 50 μm. (c) Heatmap of differentially expressed genes in mutant (Tsc1fl/fl; N = 4) vs control (Tsc1+/+; N = 4) PCs (FC > 2 and p-value<0.01; n = 679 genes). Each row of the heatmap represents the scaled expression of one gene, where red corresponds to higher relative expression and blue corresponds to lower relative expression. (d) This volcano plot shows the relationship between fold change, calculated Mutant-Control, and p-value across all genes. A majority of genes in this dataset demonstrate downregulation in the mutant PCs compared to control.


