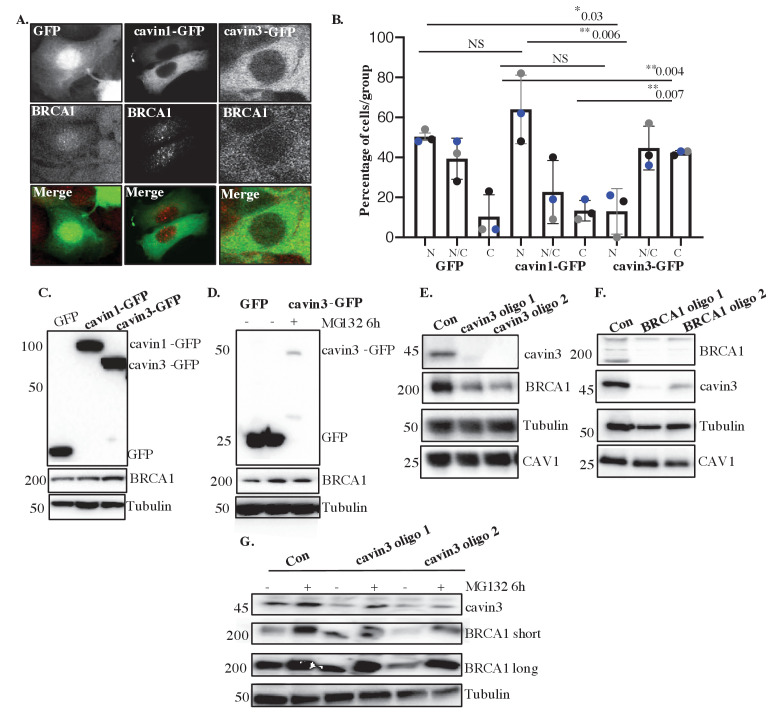
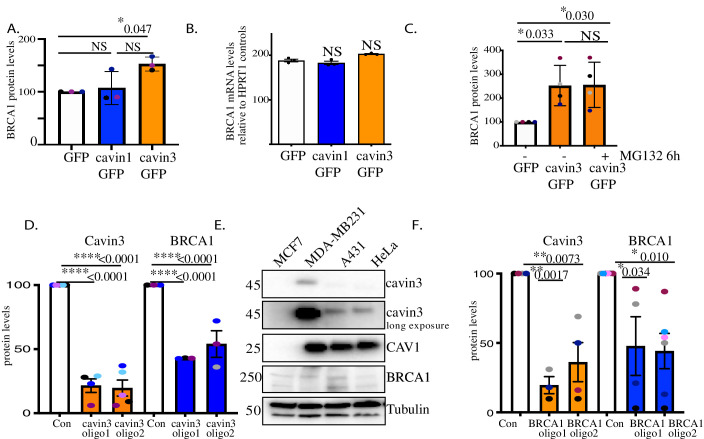
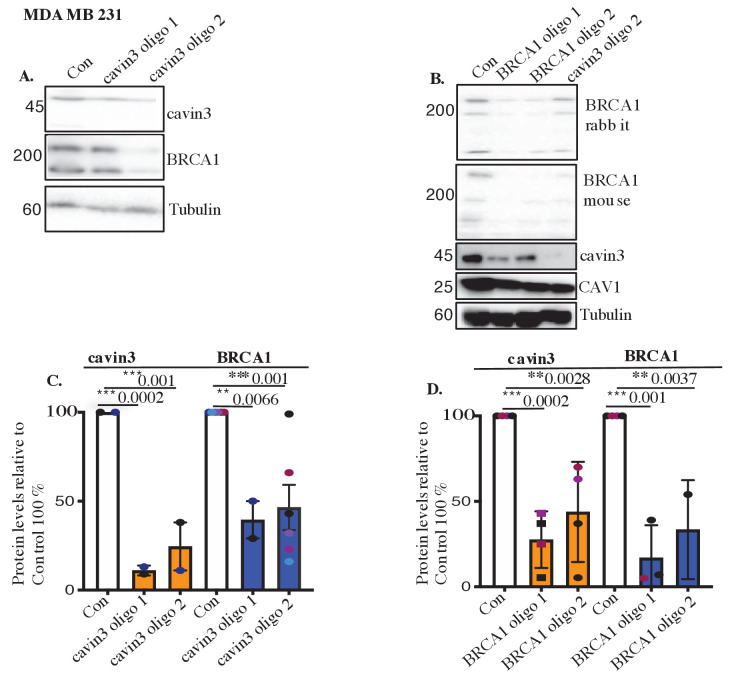
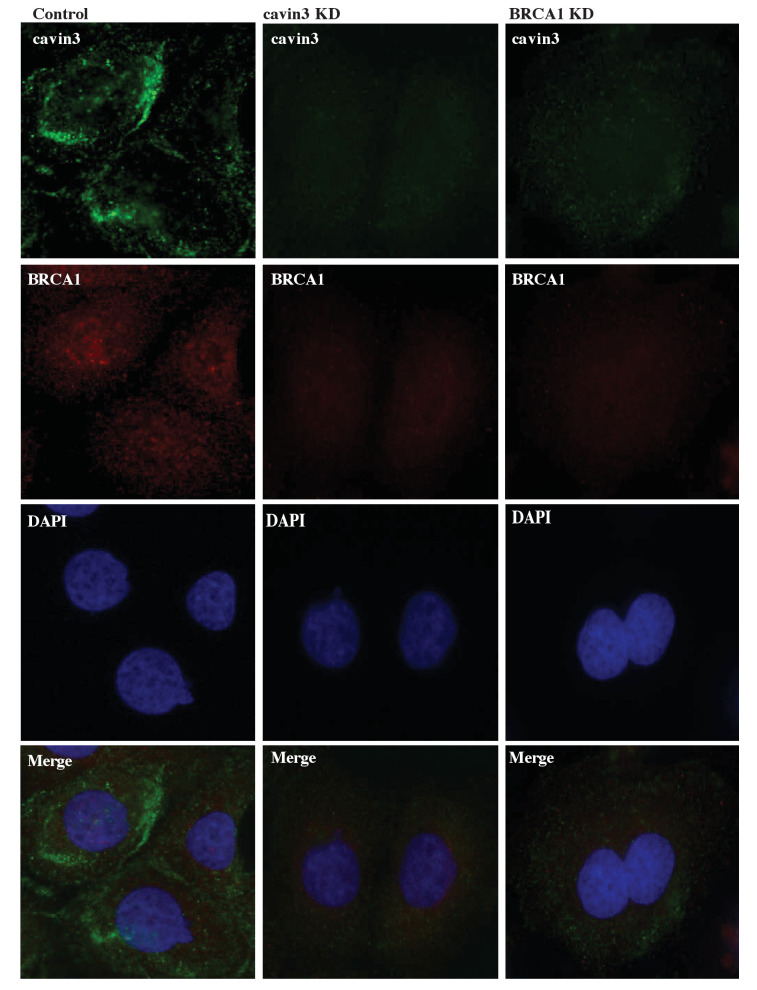
(A) Representative image of MCF7 cells stably expressing GFP alone, cavin1-GFP, and cavin3-GFP fixed and stained with a BRCA1 antibody. (B) Percentage of MCF7 cells showing strictly nuclear, nuclear-cytoplasmic, or cytoplasmic localization of BRCA1 was counted for 50 cells from 4 to 5 independent experiments as mean ± SD using a one-way ANOVA and Bonferroni’s multiple comparisons test. Each biological replicate was color-coded. NS: not significant, *p<0.05, **p<0.01. (C) Lysates from stably expressing MCF7 cells western blotted for GFP, BRCA1, and Tubulin as a load control. (D) MCF7-GFP and MCF7-cavin3-GFP cells, untreated (-) or treated with MG-132 for 6 hr. Lysates were western blotted with GFP, BRCA1, and Tubulin antibodies as a loading control. (E) A431 cells treated with control siRNAs (Con) or two siRNAs specific to cavin3. Lysates were western blotted using cavin3, BRCA1, CAV1 antibodies, and Tubulin as the loading control. (F) A431 cells treated with control siRNAs or two siRNAs specific to BRCA1. Lysates were western blotted using cavin3, BRCA1, CAV1 antibodies, and Tubulin as the loading control. (G) A431 cells treated with control (Con) or siRNAs specific to cavin3, untreated or treated with MG132 for 6 hr. Lysates were western blotted using cavin3, BRCA1, and Tubulin as a loading control. Quantitation of all blots in Figure 4 is provided in Figure 4—figure supplement 1A–E.
Figure 4—source data 1. Raw western data for MCF7 cells with molecular weight markers for Figure 4C.(A) Western blot analysis of anti-rabbit BRCA1, (B) anti-mouse Tubulin, and (C) anti-mouse GFP antibodies in (1) GFP lysates, (2) cavin1-GFP lysates, and (3) cavin3-GFP lysates.
Figure 4—source data 2. Raw western data for MCF7 cells with molecular weight markers for Figure 4D.(A) Western blot analysis of anti-mouse GFP, (B) anti-rabbit BRCA1, and (C) anti-mouse Tubulin antibodies in (1) MCF7/GFP untreated, (2) MCF7/GFP + MG132-treated lysates, and (3) MCF7/cavin3-GFP untreated lysates.
Figure 4—source data 3. Raw western data for A431 cells with molecular weight markers for Figure 4E.(A) Western blot analysis of anti-rabbit cavin3, (B) anti-rabbit CAV1, (C) anti-mouse Tubulin, and (D) anti-rabbit BRCA1 antibodies in (1) A431 cells treated with control siRNA oligos, (2) A431 cells treated with cavin3-specific siRNA oligo 1, and (3) A431 cells treated with cavin3-specific siRNA oligo 2.
Figure 4—source data 4. Raw western data for A431 cells with molecular weight markers for Figure 4F.(A) Western blot analysis of anti-rabbit BRCA1, (B) anti-mouse Tubulin, (C) anti-rabbit cavin3, and (D) anti-rabbit CAV1 antibodies in A431 cells treated with (1) control siRNA oligos, (2) A431 cells treated with BRCA1-specific siRNA oligo 1, and (3) A431 cells treated with BRCA1-specific siRNA oligo 2.
Figure 4—source data 5. Raw western data for A431 cells with molecular weight markers for Figure 4G.(A) Western blot analysis of anti-rabbit BRCA1, (B) anti-rabbit cavin3, and (C) anti-mouse Tubulin antibodies in (1) A431 cells treated with control siRNA (control KD) oligos no treatment, (2) A431 cells treated with control siRNA oligos (control KD) and MG132 for 6 hr, (3) cavin3-specific siRNA (cavin3 KD) oligo 1 no treatment, (4) cavin3-specific siRNA (cavin3 KD) oligo 1 and MG132 for 6 hr, (5) cavin3-specific siRNA (cavin3 KD) oligo 2 no treatment, and (6) cavin3-specific siRNA (cavin3 KD) oligo 2 and MG132 for 6 hr.


