. 2021 Jun 18;10:e61407. doi: 10.7554/eLife.61407

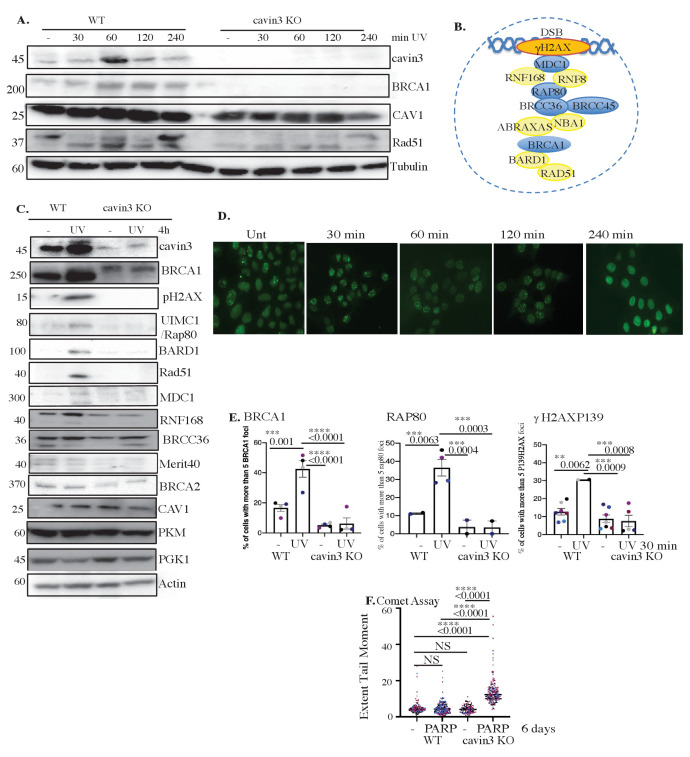
Figure 8. Cavin3-deficient HeLa cells exhibit abolishment of DNA repair.

(A) Representative western blot analysis of WT and cavin3 KO cells UV time course for cavin3, BRCA1, CAV1, Rad51, and Tubulin. (B) Protein components of the BRCA1 A-complex. Blue-colored circles: proteins downregulated in the label-free quantitative (LFQ) proteomics; yellow-colored circles: proteins not detected in the LFQ proteomics of cavin3 KO cells. (C) Representative western blot analysis of cavin3, BRCA1, pH2AX, UIM1C/Rap80, BARD1, Rad51, MDC1, RNF168, BRCC36, Merit40, BRCA2, CAV, PKM, PGK1, and Actin in WT and cavin3 KO HeLa cells untreated (-) or UV treated (UV) followed by a 4 hr chase. Quantitation of protein levels from three independent experiments is presented in Figure 8—figure supplement 1. (D) Representative immunofluorescence images of BRCA1 foci after UV treatment in WT HeLa cells. (E) Percentage of cells with more than five BRCA1 foci, Rap80 foci, and γH2AX foci in WT and cavin3 KO cells following UV treatment and a 30 min chase. The results are presented as mean ± SD using a one-way ANOVA and Bonferroni’s multiple comparisons test from three independent experiments. (F) WT and cavin3 KO cells untreated or treated with the PARP inhibitor (AZD2461, PARPi) 5 nM for 6 days were subjected to comet assays. The results are presented as the mean ± SEM using a one-way ANOVA and Bonferroni’s multiple comparisons test from three independent experiments. Each biological replicate is color-coded. Extent Tail Moment was calculated as described in Materials and methods. NS: not significant; **p<0.01, ***p<0.001; ****p<0.0001.

Figure 8—source data 1. Raw western data for HeLa WT and cavin3 KO cells time course after UV treatment with molecular weight markers for Figure 8A.
Western blot analysis of (A) anti-rabbit cavin3, (B) anti-rabbit CAV1, (C) anti-rabbit BRCA1, (D) anti-rabbit RAD51, and (E) anti-mouse Tubulin antibodies in (1) WT control, (2) WT UV 30 min chase, (3) WT UV 60 min chase, (4) WT UV 120 min chase, (5) WT UV 240 min chase, (6) cavin3 KO control, and (7) cavin3 KO UV 30 min chase, cavin3 KO UV 60 min chase, cavin3 KO UV 120 min chase, and cavin3 KO 240 min chase.
Figure 8—source data 2. Raw western data for HeLa WT and cavin3 KO cells untreated or UV treatment for 4 hr with molecular weight markers for Figure 8C.
(A) Western blot analysis of anti-rabbit cavin3, (B) anti-rabbit BRCA1, (C) anti-rabbit Rad51 and γH2AX, (D) anti-rabbit BRCC36, (E) anti-sheep Merit40, (F) anti-rabbit BRCA2, (G) anti-rabbit CAV1, (H) anti-rabbit PKM, (I) anti-rabbit PGK1, and (J) anti-actin antibodies in (1) WT untreated cells, (2) WT + UV treatment and a 4 hr chase, (3) cavin3 KO cells, and (4) cavin3 KO + UV treatment and a chase 4 hr chase time.

Figure 8.

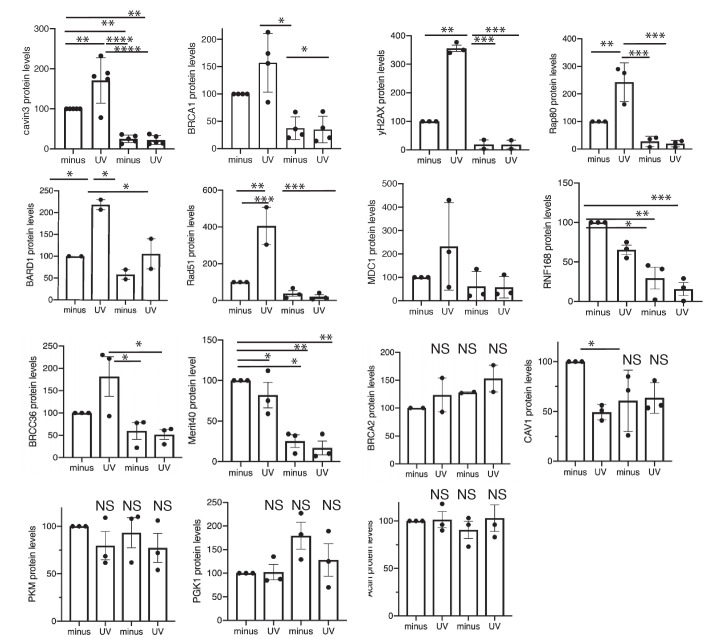
Figure 8—figure supplement 1. Quantitation of BRCA1-A-complex proteins in WT and cavin3 KO cells.

Figure 8—figure supplement 1.

Densitometry analysis was performed of the protein levels of cavin3, BRCA1, P139 γH2AX, RAP80, BARD1, RAD51, MDC1, RNF168, BRCC36, Merit40, BRCA2, CAV1, PKM, PGK1, and Actin in Figure 8A, C in WT and cavin3 KO cells subjected to UV treatment and a 4 hr chase from 2 to 3 independent experiments presented as mean ± SD using a one-way ANOVA and Bonferroni’s multiple comparisons test. NS: not significant; *p<0.05, **p<0.01, ***p<0.001, ****p<0.0001.
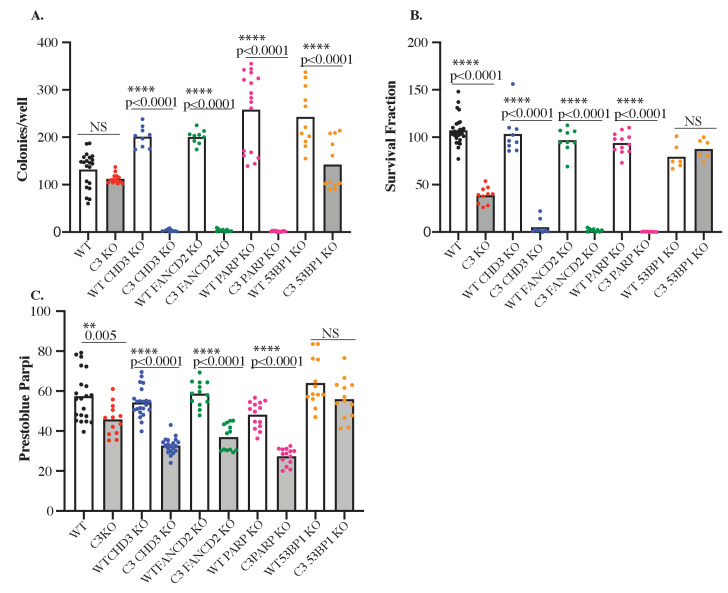
Figure 8—figure supplement 2. Cavin3 KO cells are sensitive to PARP inhibition, and 53BP1 loss causes PARP inhibitor reversion.

Figure 8—figure supplement 2.

(A) WT HeLa (black dots) and cavin3 KO cells (red dots), depleted of CHD3 (blue dots), FANCD2 (green dots), PARP1 (pink dots), and 53BP1 (orange dots) seeded at low density without treatment were allowed to form colonies for 6 days. Colonies were fixed and stained with 0.5% crystal violet/20% ethanol and colonies larger than 50 cells were counted. Each dot represents the number of colonies in a six-well dish. (B) WT HeLa (black dots) and cavin3 KO cells (red dots), depleted of CHD3 (blue dots), FANCD2 (green dots), PARP1 (pink dots), and 53BP1 (orange dots) seeded at low density were treated with 5 nM AZD2461 and were allowed to form colonies for 6 days. Colonies were fixed and stained with 0.5% crystal violet/20% ethanol and colonies larger than 50 cells were counted. Each dot represents the number of colonies in a six-well dish. (C) WT HeLa (black dots) and cavin3 KO cells (red dots), depleted of CHD3 (blue dots), FANCD2 (green dots), PARP1 (pink dots), and 53BP1 (orange dots) seeded at low density were treated with 5 nM AZD2461 for 6 days followed by PrestoBlue addition and quantitation.
Figure 8—figure supplement 2—source data 1. Raw western data for HeLa WT and cavin3 KO cells depleted of FANCD2, PARP1, CHD3, and 53BP1 with molecular weight markers for Figure 8—figure supplement 2.
(A) Western blot analysis of anti-rabbit FANCD2 and (B) anti-mouse actin antibodies in (1) WT HeLa, (2) WT HeLa + FANCD2 KO, (3) cavin3 KO, and (4) cavin3 KO + FANCD2 KO cells. (C) Western blot analysis of anti-rabbit PARP1 and (D) anti-mouse Tubulin antibodies in (1) WT HeLa, (2) WT HeLa + PARP1 KO clone 1, (3) cavin3 KO, (4) cavin3 KO + PARP1 KO clone 1, (5) WT HeLa, (6) WT + PARP1 KO clone 3, (7) cavin3 KO, and (8) cavin3 KO + PARP1 clone 3 cells. (E) Western blot analysis of anti-rabbit CHD3 and (F) anti-mouse Tubulin antibodies in (1) WT HeLa, (2) WT + CHD3 KO clone 1, (3) WT + CHD3 KO clone 3, (4) cavin3 KO cells, (5) cavin3 KO + CHD3 clone 1, and (6) cavin3 KO + CHD3 clone 3. (G) Western blot analysis of anti-rabbit 53BP1 and (H) anti-mouse Tubulin antibodies in (1) WT HeLa, (2) WT + 53BP1 KO, (3) cavin3 KO, and (4) cavin3 KO + 53BP1 KO cells.