. 2021 Jun 28;10:e65184. doi: 10.7554/eLife.65184

Figure 2. Impact of topoisomerase 2α (TOP2A) in the cell toxicity of topoisomerase poisons and G-quadruplex (G4) ligands.

(A, B) Summary of mutations found in CX-5461-resistant (CXR) (A) and F14R (B) clones. (C, E) Viability assay of CXR cells treated with etoposide (ETP) (C) and the G4 ligand pyridostatin (PDS) (E). (D, F) Viability assay of F14512-resistant cells (F14R) treated with the G4 ligands CX-5461 (D) and PDS (F). (G) Viability assay of TOP2A knock-down HAP1 cells treated with G4 ligand CX-5461 (left panel), PDS (central panel), and ETP (right panel). Error bars represent SD from the means, n ≥ 3 independent experiments.

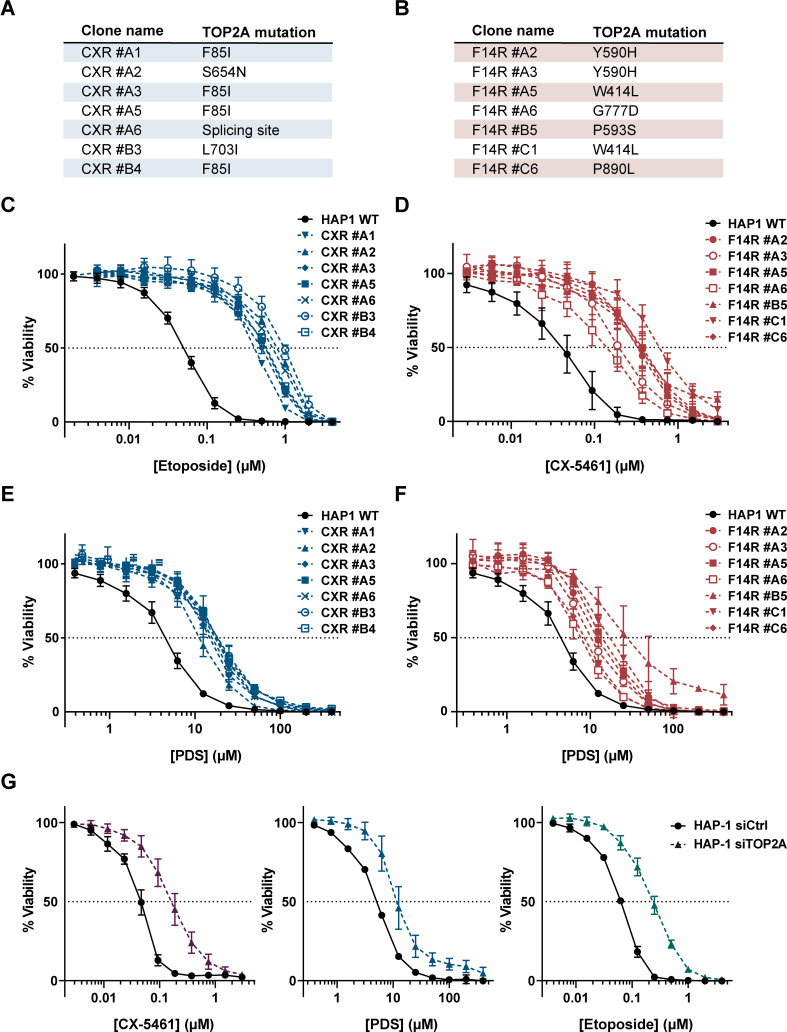
Figure 2—source data 1. Raw unedited image and uncropped figure of the blot of the western blot from Figure 2.
Ponceau staining (left panel) and hybridization signals (center and right panel) are shown. Raw images correspond to the scanning of autoradiography films.

Figure 2.

Figure 2—figure supplement 1. Analysis of etoposide-induced topoisomerase 2α (TOP2A) cleavage complexes in wild-type and CX-5461-resistant (CXR) HAP1.

Figure 2—figure supplement 1.

In this assay, TOP2 proteins not covalently attached to DNA are extracted by heparin in the soluble fraction, while TOP2 cleavage complexes are resistant to this procedure and can be analyzed after centrifugation by immunoblotting of the pellet fraction. TOP2A point mutations in clones CXR #A6 (TOP2A with a different C-terminus) and CXR #A1 (TOP2A F85I) decreased the level of etoposide-induced TOP2Acc. Relative protein levels of TOP2A were quantified, normalized to H2AX level, and set to 100 in wild-type (WT) cells treated with etoposide.
Figure 2—figure supplement 1—source data 1. Raw unedited image and uncropped figure of the blot of the western blot from Figure 2—figure supplement 1.
Ponceau staining (left panel), membrane (center panel), and hybridization signals (right panel) are shown. Raw images were acquired using the ChemiDoc system (Bio-Rad). Asterisks indicate the edges of cut membranes before hybridization. The section of the blot used for the final figure is indicated by the dashed rectangle.
Figure 2—figure supplement 2. Cell proliferation and DNA repair studies in wild-type (WT) and CX-5461-resistant (CXR) HAP1 cells.

Figure 2—figure supplement 2.

(A) Population doubling time of WT, CXR, and F14512-resistant (F14R) HAP1 cells. Error bars represent SD from the means, n ≥ 3 independent experiments. A one-way ANOVA test revealed no significant (ns) difference between the doubling time of resistant clones and the WT HAP. (B) Flow cytometry analysis of cell cycle repartition and rate of DNA synthesis in WT, CXR, and F14R HAP1 cells. (C) Viability assay of WT, CXR, and F14R HAP1 cells treated with camptothecin and calicheamicin in the presence of the DNA-Pk inhibitor (DNA-PKi) NU-7441 (2 µM). DNA-PKi was added 1 hr prior to addition of drugs. (D) Graphic representation of the sensitization effect induced by the DNA-PKi on camptothecin and calicheamicin treatments in WT, CXR, and F14R HAP1. (E) Flow cytometry analysis of γH2AX signals in WT, CXR, and F14R HAP1 following irradiation exposure (10 Gy X-ray). γH2AX signal was measured in untreated cells (orange), or 15 min (red) and 16 hr (blue) after irradiation. (F) Western blotting analysis and quantification of topoisomerase 1 level in WT, CXR, and F14R HAP1 cells. (G) Viability assay of WT, CXR, and F14R HAP1 cells treated with PhenDC3 and RHPS4. Error bars represent SD from the means, n ≥ 3 independent experiments.
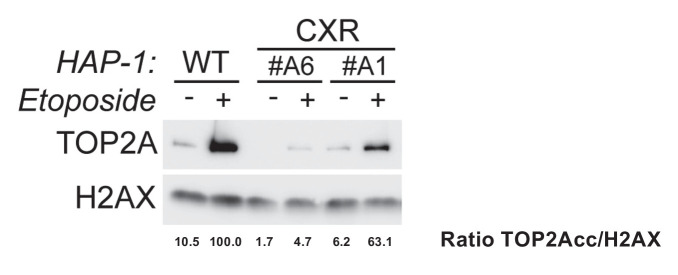
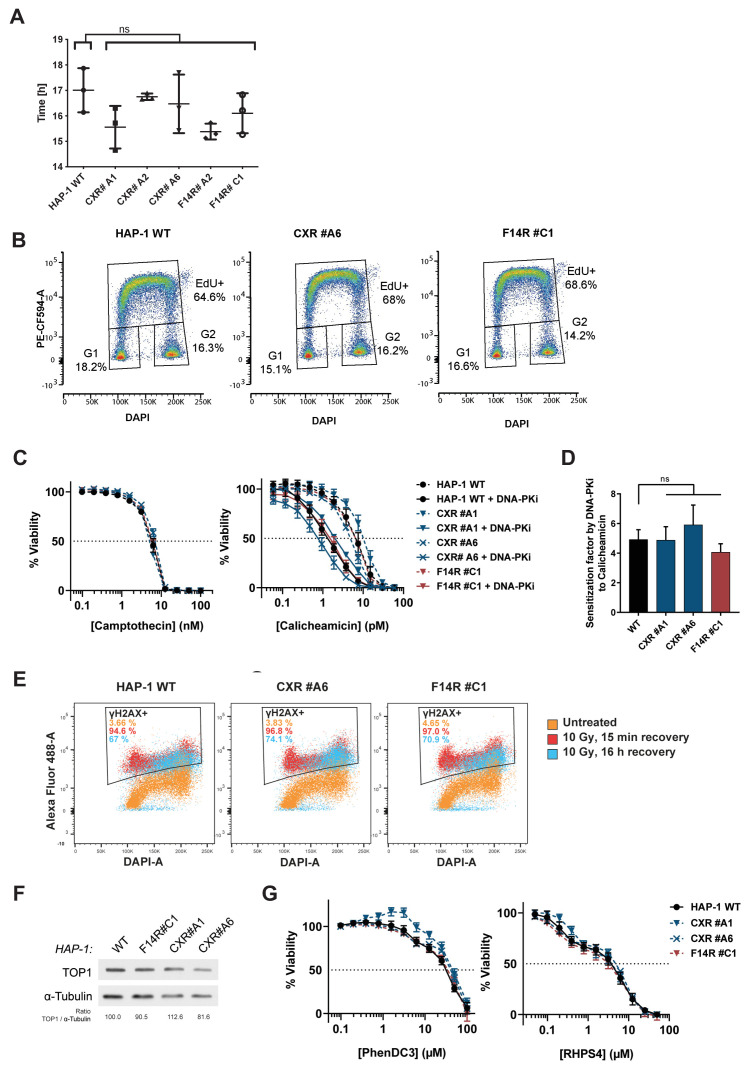
Figure 2—figure supplement 2—source data 1. Raw unedited image and uncropped figure of the blot of the western blot from Figure 2—figure supplement 2.
Ponceau staining (left panel) and hybridization signals (right panel) are shown. Raw images correspond to the scanning of autoradiography films. The section of the blot used for the final figure is indicated by the dashed rectangle.