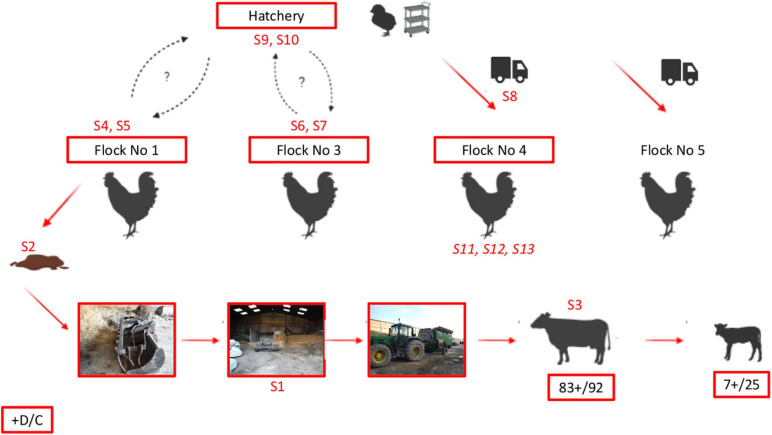
FIGURE 3.
Diagram summarizing the likely relationships between the broilers, cattle, and hatchery based on investigations and results obtained in this study. Samples collected during the study and positive for C. botulinum type D/C are shown in red. References of samples tested using MLVA (Figure 2) are mentioned in the diagram. Note that samples S11–S13 are shown in italics in contrast to the other samples (S1–S10), because they showed a different MLVA profile (Figure 2). “+ D/C”: sample positive for bont D/C using PCR are surrounded in Red. Detailed results of samples collected and analyzed in our study are given in Table 1 (initial investigations during cattle botulism outbreak), Table 2 (monitoring of successive broiler flocks), and Table 3 (investigations in the hatchery that delivers chicks to the farm).

