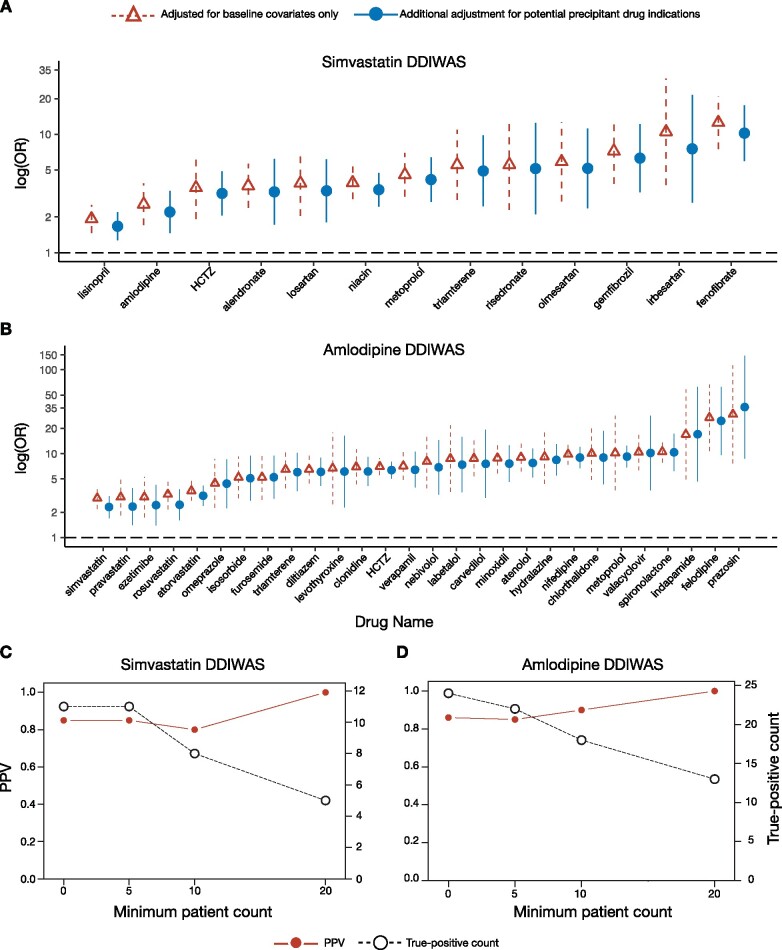
Figure 2.
Forest plot of potential precipitant drugs associated with object drug ADRs and DDIWAS performance. (A, B) Forest plots summarizing the potential precipitant drugs that were significantly associated (logistic regression Bonferroni P value < .05 and OR > 1) with (A) simvastatin- and (B) amlodipine-ADRs. On the horizontal axis, potential precipitant drugs are sorted from smallest to largest ORs. On the vertical axis, association ORs (95% CI) are plotted on a logarithmic scale. Red triangles with dashed lines represent values from logistic regressions adjusted for age, sex, race, length of observation period, and number of unique drug exposures for each patient. Blue circles with solid lines indicate values from logistic regressions with additional adjustment for potential precipitant drug indications. These values were from analyses with a minimum patient count threshold of 1. Minimum patient count threshold refers to the number of patients required in each cell of the 2x2 contingency table (Supplementary Figure 3). The Bonferroni correction was 1.77x10⁻⁴ (0.05/282) for simvastatin and 1.49 x 10⁻⁴ (0.05/335) for amlodipine. See Supplementary Table 2 for corresponding numbers. (C, D) PPV (left vertical axis) and true-positive count (right vertical axis) for (C) simvastatin and (D) amlodipine DDIWAS at minimum patient count thresholds of 1, 5, 10, and 20. True-positive count refers to the number of potential precipitant drugs (logistic regression Bonferroni P value < .05 and OR > 1) that were known to interact with the object drug. See Supplementary Table 3 for corresponding numbers.
Abbreviations: ADR, adverse drug reaction; DDIWAS, Drug-Drug Interaction Wide Association Study; HCTZ, hydrochlorothiazide; PPV, positive predictive value; OR, odds ratio; 95% CI: 95% confidence interval.

