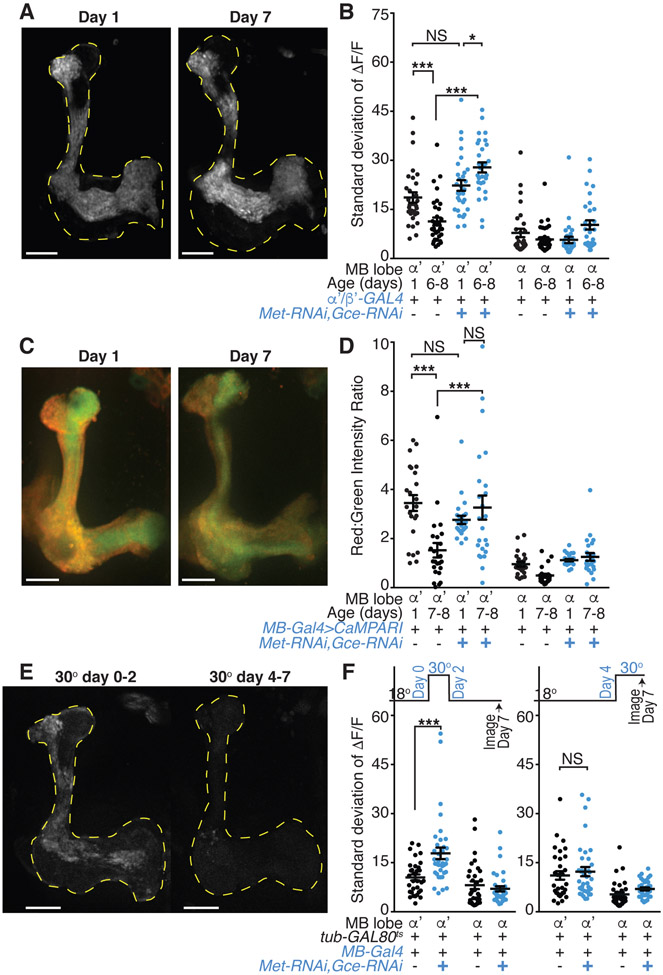
Figure 3. Juvenile hormone signaling via Met and Gce downregulates spontaneous α’/β’ activity.
(A) Representative standard deviation projection images of flies with α’/β’ expression of Met and Gce RNAi transgenes show MB lobe (yellow dotted lines) regions with high GCaMP6s activity at day 1 or day 7.
(B) KC activity in genetic controls and in flies with α’/β’ expression of Met and Gce RNAi transgenes at day 1 or 6-8. N=15-17 flies with each hemisphere of the brain shown as one point.
(C) Representative images of photoconverted CaMPARI in Met and Gce RNAi expressing KCs at day 1 or day 7. Red fluorescence indicates high activity at time of in vivo UV stimulus presentation.
(D) Red to green intensity ratio quantification of CaMPARI signal in large ROIs drawn from α’ and α lobes of genetic controls or flies with KC expression of Met and Gce RNAi at day 1 or day 7-8. N=12 flies with each hemisphere of the brain shown as one point.
(E) Representative standard deviation projection images of day 7 flies with KC-specific Met and Gce knockdown temporally restricted (by the repressor tub-GAL80ts and a shift to 30 °C) to the immediate post-eclosion period (day 0-2) or to later in adulthood (day 4-7).
(F) KC activity in genetic controls and in flies with KC expression of Met and Gce RNAi transgenes temporally restricted by the repressor tub-GAL80ts. Flies were shifted from 18 to 30 degrees Celsius to induce the RNAi from either (left graph) eclosion until day 2, then returned to 18 degrees until imaging as mature day 7 animals, or (right graph) day 4 until immediately prior to imaging on day 7. N=16-18 flies with each hemisphere of the brain shown as one point.
(A, C, and E) White scale bars are 20 μm. (B and F) Each point is activity in median ROI for indicated lobe. (B, D, and F) Error bars are mean and SEM. NS, P>0.05 and ***P<0.001, *P<0.05, 2-way ANOVA with Sidak’s multiple comparisons test. All comparisons for α lobe are NS. See also Figure S3.

