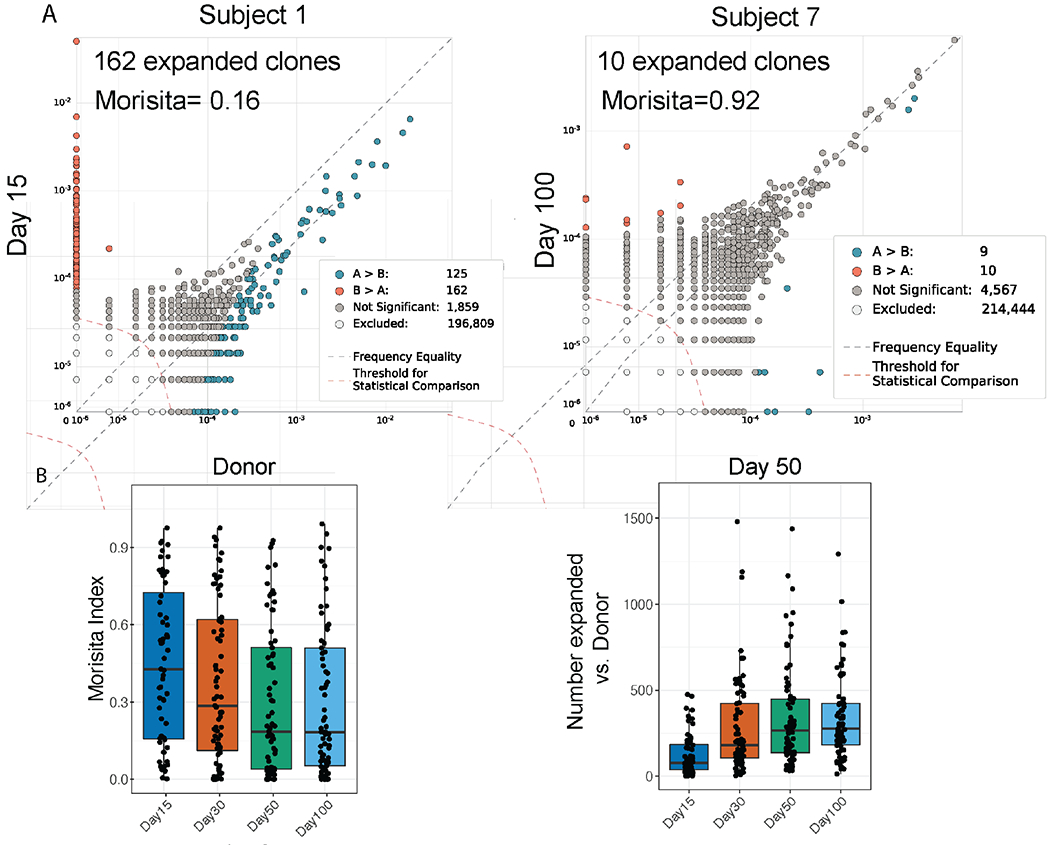
Figure 2. Post-Transplant versus Donor Repertoire.

A. Examples of repertoire comparisons between two samples with either extensive turnover (left), or limited turnover (right). The legend quantifies expanded clones (B > A) and contracted clones (A > B). B. Morisita’s Index and number of expanded clones compared to donor samples at the indicated time points. P values in the upper left corners indicate overall differences by Kruskall Wallis test.
