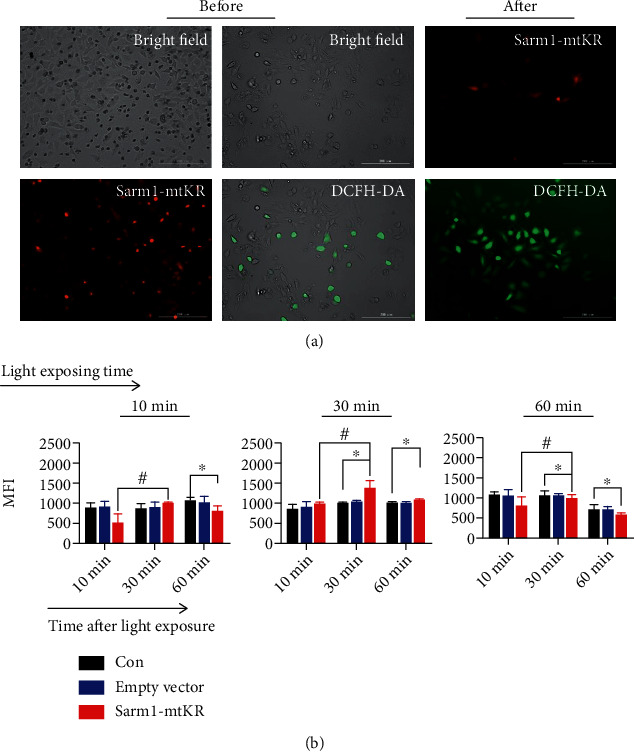
Figure 3.

ROS content detection by DCFH-DA staining in HeLa cells. (a) Representative images of KR before and after light exposure for 30 min, and cells were stained by DCFH-DA (green), scale bars, 200 μm. (b) The changes of MFIs at different time postlight exposure for 10, 30, and 60 min, respectively. Bars represent mean ± SD of triplicate measurements. ∗P < 0.05, versus control, #P < 0.05, versus 10 min after light exposure.
