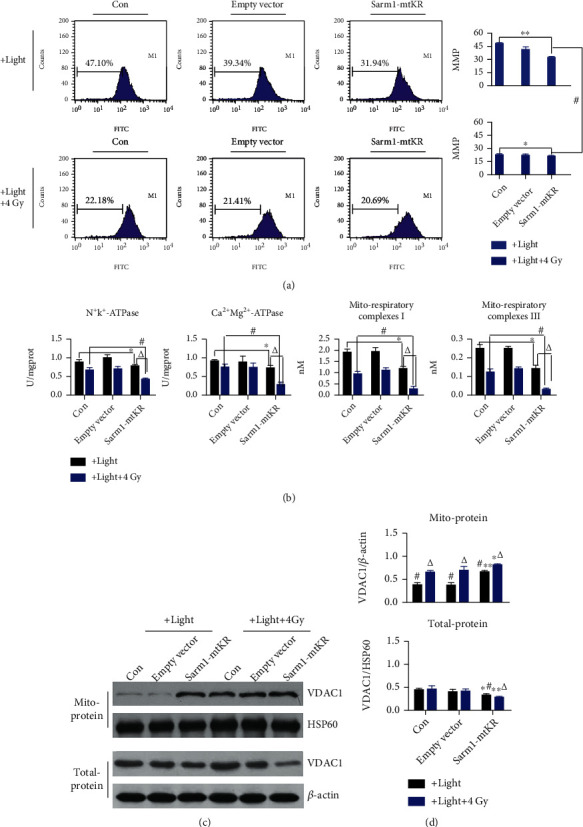
Figure 4.

Mitochondrial dysfunction caused by mROS from Sarm1-KR and IR. (a) Representative FCM pictures of MMP in HeLa cells stained by Rh123 and analyzed by FCM. (b) The changes of Na+K+-ATPases, Ca2+Mg2+-ATPase, and mito-respiratory complex I and III activities by biochemical assay after light exposure and IR. (c) WB analysis was performed to determine protein levels of VDAC1 in total- and mito-protein. β-Actin and HSP60 proteins were used for loading control. (d) From top to bottom, the changes of VDAC1/β-actin and VDAC1/HSP60. Bars represent mean ± SD of triplicate measurements. ∗P < 0.05 and ∗∗P < 0.01, versus control; #P < 0.05, versus 4 Gy IR; and △P < 0.05, versus light exposure.
