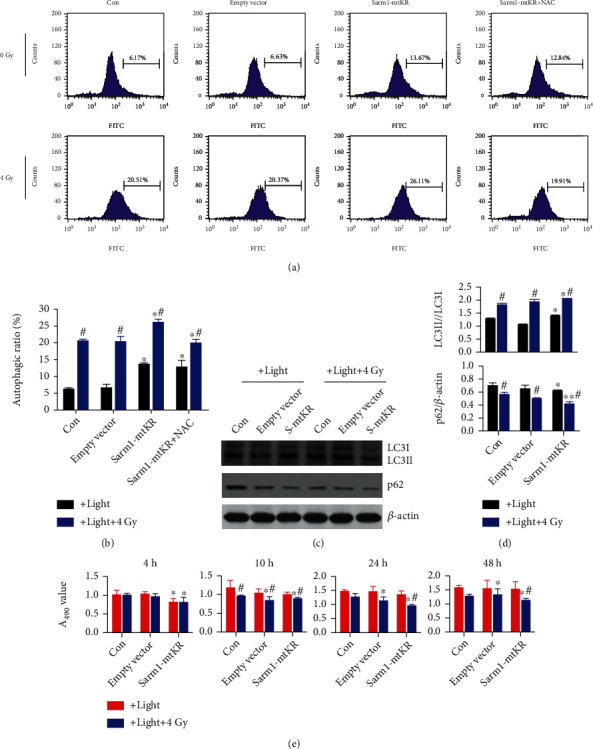
Figure 5.

Sarm1-mtKR and IR promote autophagy and growth inhibition. (a) Representative pictures of autophagy detected by FCM in HeLa cells transfected with Sarm1-mtKR plasmids and followed NAC and IR treatment. (b) Statistical analysis of the autophagic rates was performed based on FCM data. (c) LC3 and p62 expression was detected by WB, and β-actin was used for loading control. (d) From top to bottom, the changes of LC3II/LC3I and p62/β-actin. (e) CCK8 assay demonstrates the inhibitory effects in HeLa cells transfected with Sarm1-mtKR plasmids and IR treatment. Bars represent mean ± SD of triplicate measurements. ∗P < 0.05 and ∗∗P < 0.01, versus control; #P < 0.05, versus light exposure.
