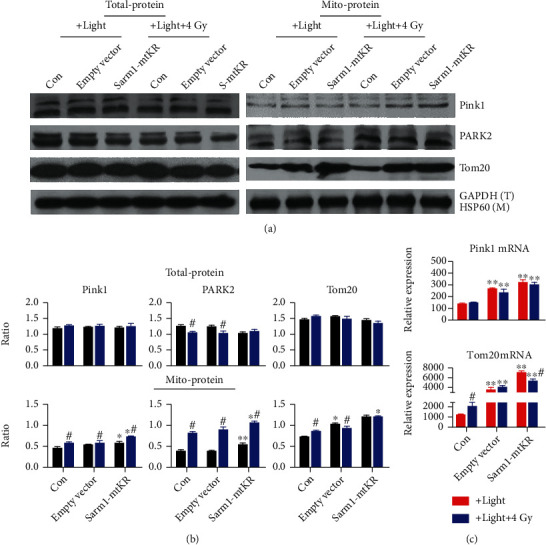
Figure 6.

Sarm1-mtKR-induced mtROS participated in the autophagic cell death depending on the Pink1/PARK2 pathway. (a) WB was performed to determine protein levels of Pink1, PARK2, and Tom20 in total- and mito-proteins. GAPDH and HSP60 proteins were used for loading control. (b) The gray ratios of Pink1, PARK2, and Tom20 in total- and mito-proteins. (c) Pink1 and Tom20 mRNAs detected by qRT-PCR. Bars represent mean ± SD of triplicate measurements. ∗P < 0.05 and ∗∗P < 0.01, versus control; #P < 0.05, versus light exposure.
