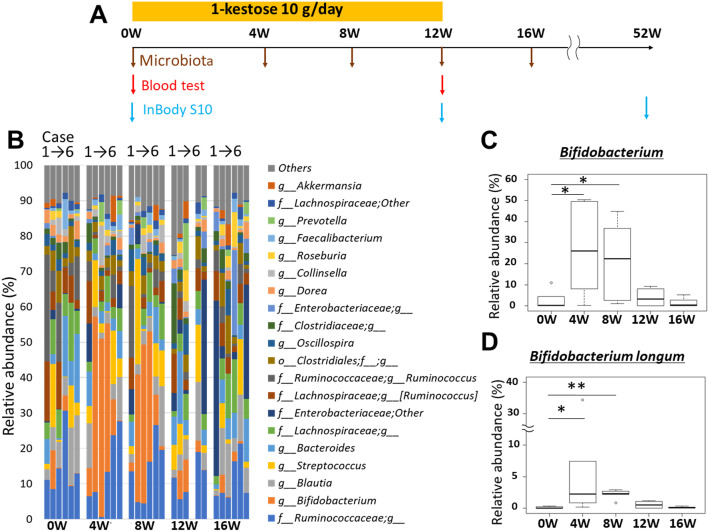
Fig. 1.
. Schema of the study protocol (A). Time course analysis of the intestinal microbiota. The data are shown for cases 1–6 at every time point (before and 4, 8, 12, and 16 weeks after 1-kestose administration) (B). Time course of Bifidobacterium at the genus level (C). Time course of Bifidobacterium longum at the species level (D). Bars show the SD of the data. Data were analyzed using the Friedman test, followed by the Wilcoxon signed-rank test (*p<0.05; **p<0.01).

