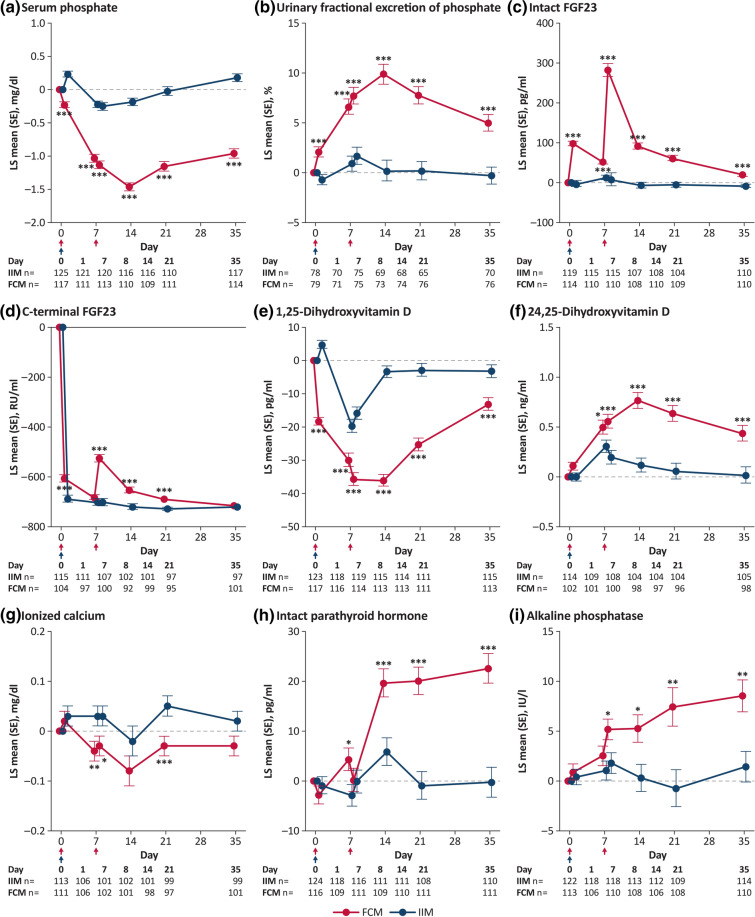
Fig. 1.
LS mean changes from baseline in biomarkers of mineral and bone homeostasis according to iron treatment. Red arrows indicate infusion of ferric carboxymaltose, 750 mg; blue arrows indicate infusion of iron isomaltoside, 1000 mg. *P < 0.05, **P < 0.01, ***P < 0.001 between-group comparisons from a mixed model for repeated measures analysis with treatment day, treatment-by-day, trial and stratum as fixed effects and baseline value and baseline value-by-day as covariates; safety analysis set. FCM, ferric carboxymaltose; FGF23, fibroblast growth factor 23; IIM, iron isomaltoside 1000/ferric derisomaltose; LS, least squares; SE, standard error. Reproduced with permission from JAMA. 2020;323(5):432–443. Copyright©(2020) American Medical Association. All rights reserved.

