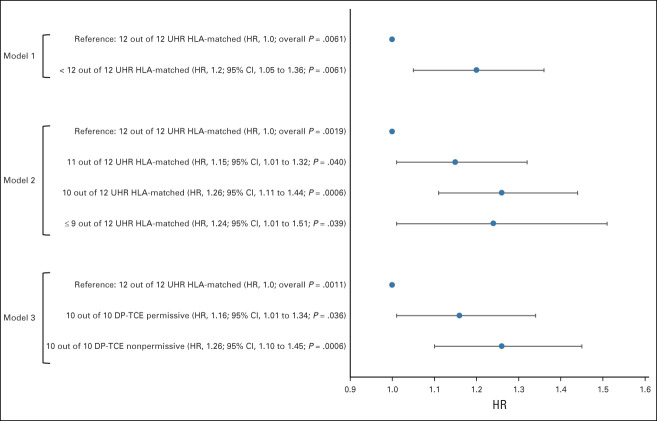
FIG 1.
A forest plot showing the adjusted hazard ratio of aGVHD in the overall cohort (N = 5,140) for the three analysis models. The analysis was stratified by year of transplant and adjusted for disease, GVHD prophylaxis, HCT-CI, use of T-cell depletion, conditioning regimen, graft type, and disease status. aGVHD, acute graft-versus-host disease; HCT-CI, Hematopoietic Cell Transplantation Comorbidity Index; HR, hazard ratio; TCE, T-cell epitope; UHR, ultrahigh resolution.

